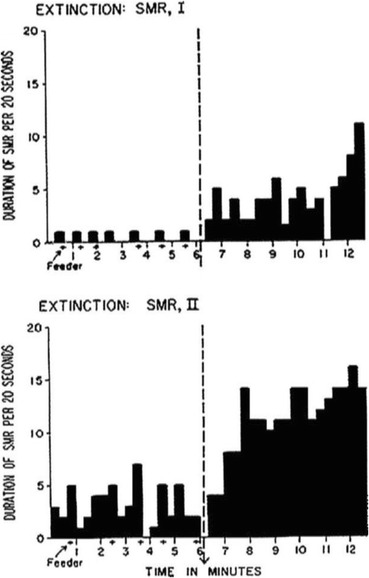
Fig. 1.

Extinction bursts involving the sensorimotor brain response in cats. The y-axis represents duration of each brain response, and the x-axis represents time in minutes. The dotted vertical line represents the moment in which organisms were put on extinction. Reproduced with permission from Wyrwicka and Sterman (1968)
