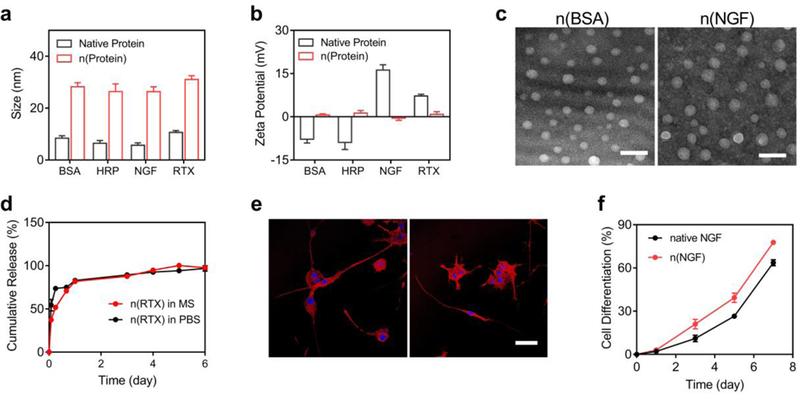
Figure 2. Structure, morphology, and sustainable release of the protein nanocapsules.

a, The average size and b, zeta potential of n(BSA), n(HRP), n(NGF), n(RTX), and their native counterparts. c, TEM images of n(BSA) and n(NGF) showing a uniform size around 30 nm. Scale bar, 100 nm. d, RTX releasing profiles of n(RTX) in mouse serum (MS) and PBS (25 μg/mL) at 37 ˚C as determined by ELISA. e, Confocal microscopy images of PC12 cells treated with 100 ng/mL native NGF (left) or n(NGF) (right), respectively. The nuclei and actin were stained by Hoechst 33342 and Texas Red–Phalloidin. Scale bar, 50 μm. f, The percentage of differentiated PC12 cells induced by native NGF or NGF released from n(NGF). The percentage was calculated by counting the number of cells, with at least one neurite of which the length is equal to or longer than the diameter of the cell body, vs. the total cell population. Error bars represent the s.e.m. of triplicate samples (n=3).
