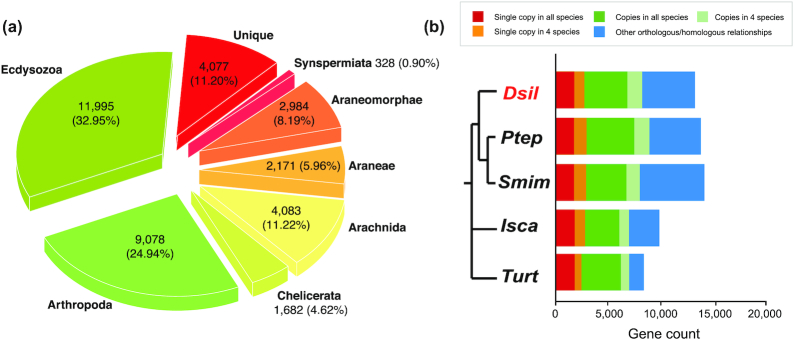
Figure 4.
(a) Pie chart illustrating the taxonomic distribution of positive BLAST hits of the D. silvatica protein-coding genes against the sequence data of species included in Fig. 2. (b) Homology relationships among D. silvatica (Dsil) and different chelicerates genomes available in OrthoDB v10 [56], Parasteatoda tepidariorum (Ptep), Stegodyphus mimosarum (Smim), Ixodes scapularis (Isca), and Tetranychus urticae (Turt). Red and orange bars indicate the fraction of single-copy genes (1:1 orthologs) identified in all species, and in all but 1 (e.g., missing in 1 species), respectively. The dark and light green bar indicate the fraction of orthologs present in all species and in all but 1, respectively, that are not included in previous categories. The blue bar (other orthology/homology) shows other more complex homologous relationships. The results were generated by uploading D. silvatica proteins to the OrthoDB web server.

