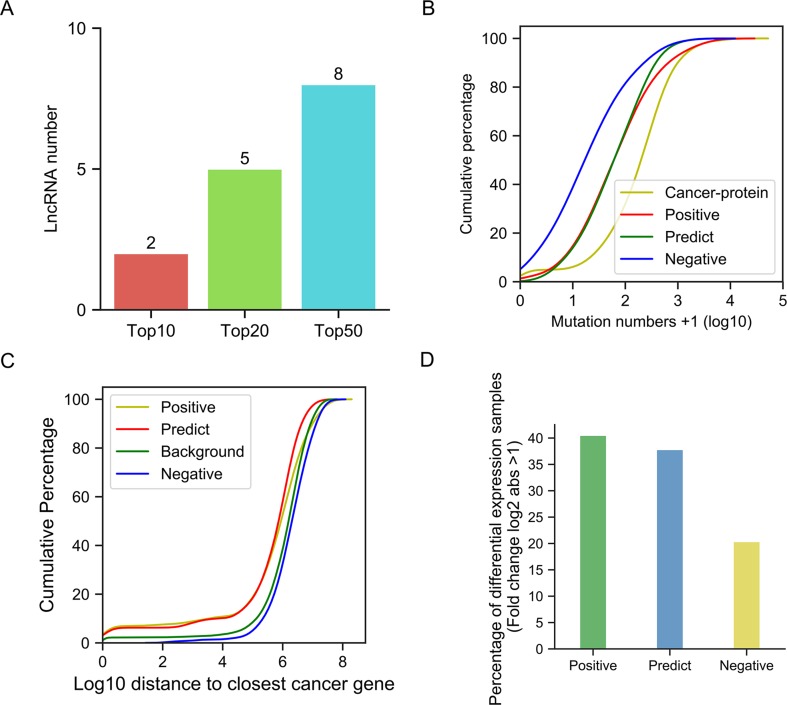
Figure 7.
Validation of our predictions. (A) Bar plots of cancer-related lncRNA numbers confirmed by Lnc2Cancer in the top 10, top 20, and top 50. (B) Cumulative distribution of mutation number. (C) Cumulative distribution of the closest distance to cancer-related proteins. (D) Bar plot of the percentage of differentially expressed lncRNAs.

