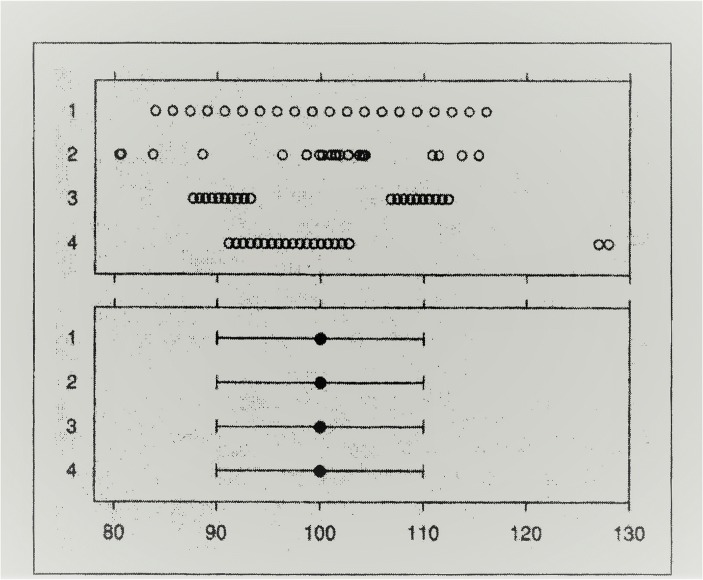
Fig. 2.
Upper panel: Four horizontally arrayed distributions of twenty values, with each symbol representing a value along the X-axis. Lower panel: The corresponding means and standard deviations of the four distributions shown in the top panel. From Cleveland (1994, p.251, Figure 3.76.) Reprinted with permission, courtesy of AT&T Archives and History Center

