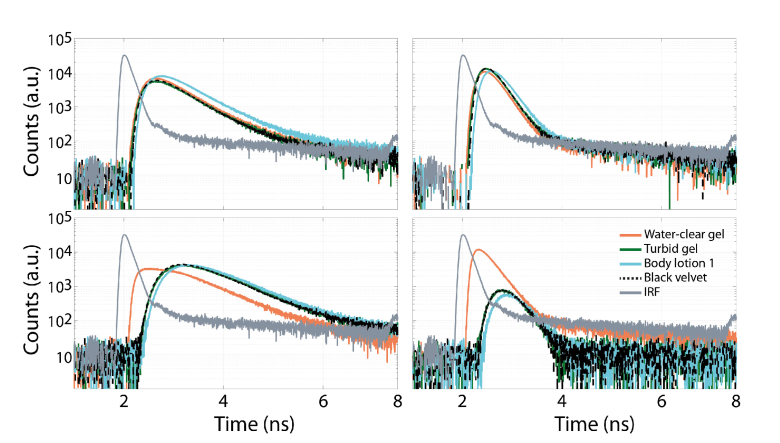
Fig. 11.
Raw DTOF curves recorded at 800 nm with SDD = 3 cm, and corresponding to the outmost plots of Fig. 3 and Fig. 5 (i.e. lowest/highest scattering on first /second row and lowest/highest absorption on the first/second column) when using water-clear gel (orange line), turbid gel (green line), body lotion 1 (blue line) and black velvet (black line). To better enlighten the effect of the direct light also the IRF (gray line) is reported in each graph.

