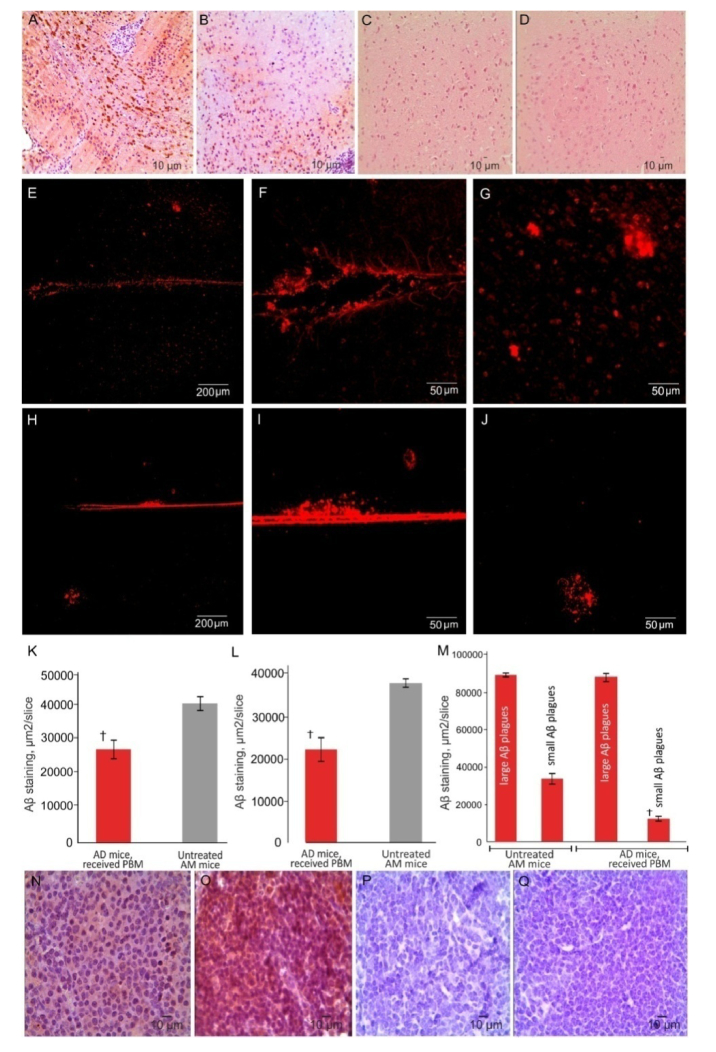
Fig. 2.
PBM effects on distribution of Aβ deposition in the mouse brain: A-D – ICH imaging of Aβ depositions in the brain tissues in untreated mice with AD (A), in mice with AD after PBM (B), in the shem group (C) and in intact mice from the control group (D); E-M – Confocal and quantitative analysis of Aβ distribution in the brain tissues of untreated mice with AD (E-G), in mice with AD after PBM (H-J); K-M – quantitative analysis of presence of Aβ plagues in tested tissues in untreated mice with AD and mice with AD, received PBM: K – in the brain (ICH data); L - in dcLN (ICH data); M – in the brain (small and large Aβ plagues, confocal data); N-Q – ICH data of Aβ depositions in dcLNs in untreated mice with AD (N), in mice with AD, received PBM (O), in the shem group (P) and in intact mice from the control group (Q). n = 7 for each group, at least 10 individual tissue sections taken for each animal. † - p<0.001 between groups.

