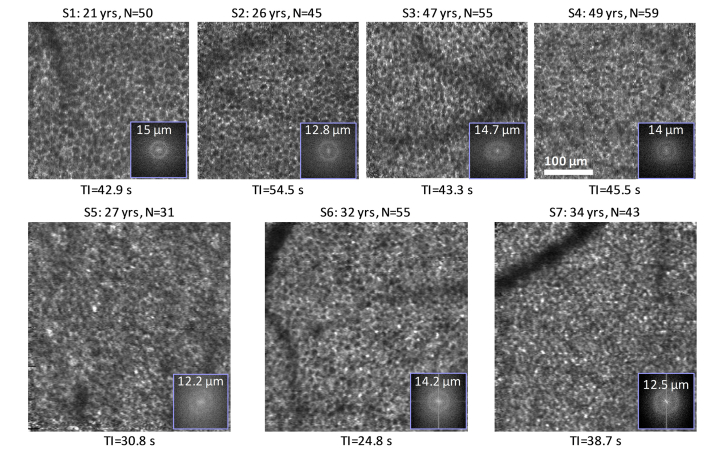
Fig. 2.
Averaged and registered RPE images for the seven subjects imaged at 7° temporal to the fovea. N is the total number of images averaged. TI denotes mean time intervals between RPE images, which were selected one per AO-OCT video. 2-D power spectra are superimposed at bottom right of each en face image.

