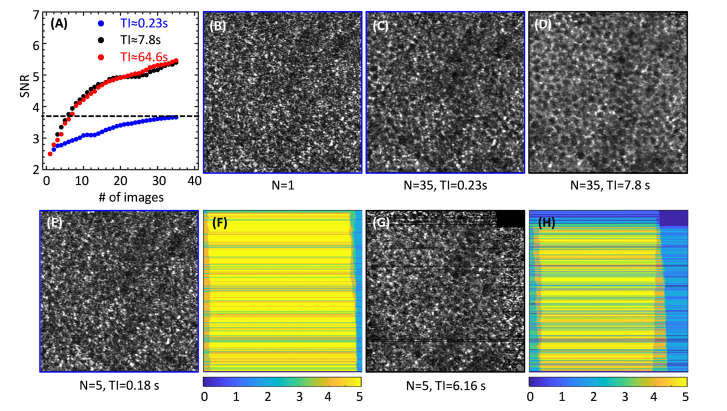
Fig. 5.
(A) Signal-to-noise ratio (SNR) of RPE mosaic fundamental frequency as a function of AO-OCT images averaged from subject S2. The RPE mosaic fundamental frequency and noise were determined from the power spectrum of the registered, averaged images. Images were acquired at averaged TI of 0.23 s (blue), 7.8 s (black) and 64.6 s (red). RPE en face images of: (B) single volume (N = 1), (C) average of 35 volumes with averaged TI = 0.23 s, (D) average of 35 volumes with TI = 7.8 s, and average of 5 volumes with averaged (E) TI = 0.18 s, and (G) TI = 6.16 s. The number of effective volumes that generate each image pixel in (E) and (G) varies between 0 and 5 depending on eye motion as shown in (F) and (H), respectively. The fast B-scan direction of the AO-OCT system is horizontal.

