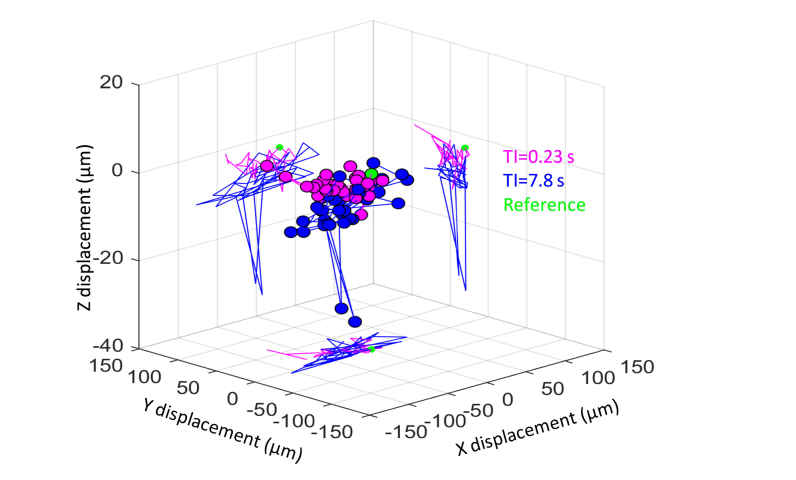
Fig. 7.
Representative eye motion measured in two series of 35 AO-OCT images in three dimensions (3-D) from S2 with different time intervals (magenta: TI = 0.23 s, and blue: TI = 7.8 s). To better visualize the individual components, the 3-D motion is projected into the x-y, x-z, and y-z planes. Green point denotes the reference image coordinate: (x, y, z) = (0, 0, 0).

