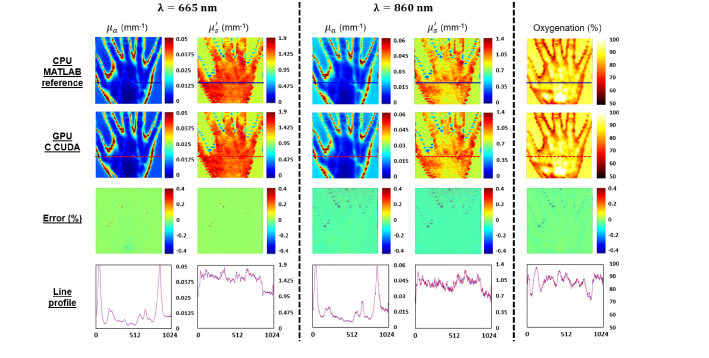
Fig. 3.
Results obtained with the MATLAB CPU reference code and with GPU C CUDA code. Absorption and reduced scattering map recovered at 665 nm (left columns) and 860 nm (center columns) and saturated oxygenation level (right column) obtained with reference MATLAB CPU processing (first row) and the custom-made GPU C CUDA processing (second row). Percentage errors compared with the reference processing (as described in Eq. (11) are also shown in the third row. Finally cross section line profiles are shown in the fourth row, in solid blue for the reference MATLAB CPU processing and in dash red for the C CUDA GPU processing.

