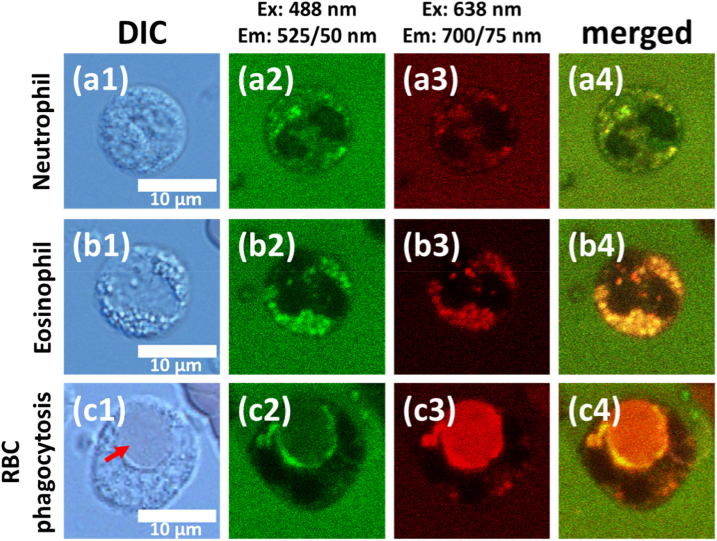
Fig. 1.
Autofluorescence confocal imaging of a) neutrophil, b) eosinophil, c) erythrophagocytic cell. (a1), (b1), (c1) correspond to DIC microscopy. (a2), (b2), (c2) represent fluorescence imaging at 488 nm excitation and 525(50) nm registration (“green” channel). (a3), (b3), (c3) represent fluorescence imaging at 638 nm excitation and 700(75) nm registration (“red” channel). (a4), (b4), (c4) represent the merged images of green and red channels, where the yellow color is due to overlay of the merged signals in different spectral channels.

