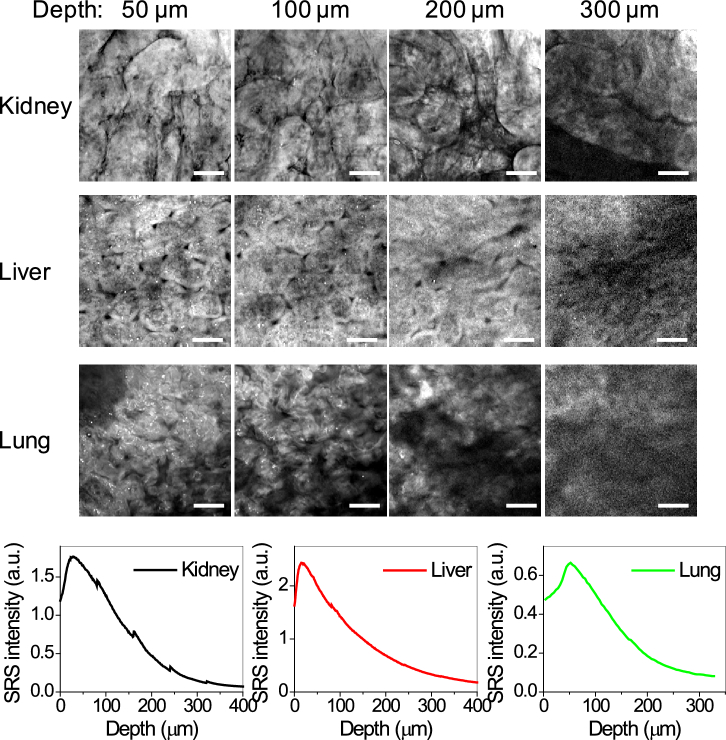
Fig. 2.
Demonstration of tissue clearance in various organs. (a) SRS images taken at 2930 cm−1 from ClearT cleared kidney, liver and lung tissue slices (∼ 1 mm thick) at indicated depth (see Visualization 5 (2.1MB, avi) –Visualization 7 (1.5MB, avi) ). Tissue organization and characteristic structures like renal tubules (kidney), lobules and veins (liver), and alveoli (lung) can be identified. Image display ranges were adjusted individually to better show the contrast. Scale bars: 20 µm. (b) Intensity profile over depth from the images in (a).

