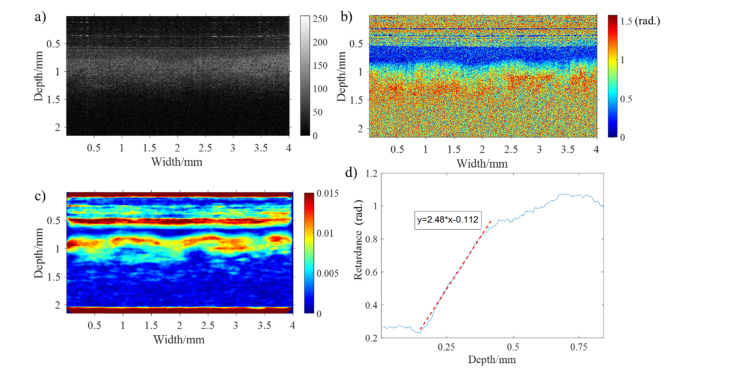
Fig. 5.
PS-OCT images of human cervical tissue in middle area: a) intensity image, b) retardance image, c) birefringence image (Note that the birefringence situated at sample surface layer is artifact, because the rapid change of retardance between noise and sample surface can lead to false birefringence signal.). d) the plot of averaged retardance as a function of depth (Red dashed: linear regression line of retardance for calculating birefringence of collagen).

