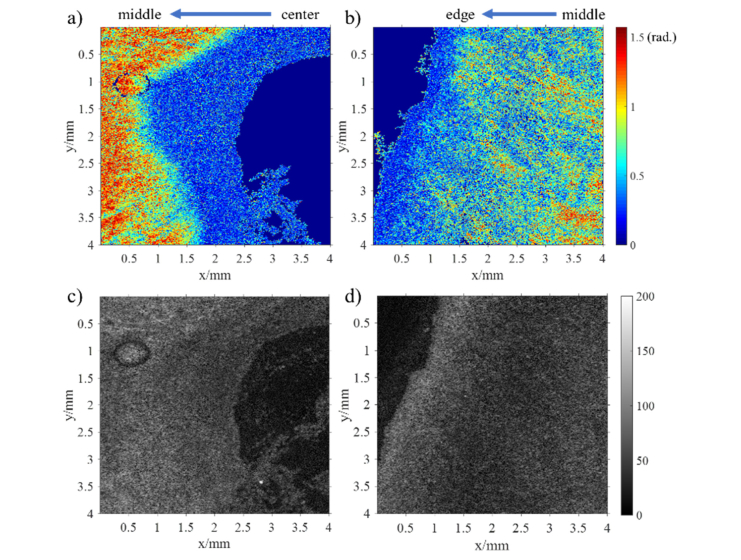
Fig. 10.
The en-face images of retardance and intensity (at 400 µm depth). a) and b) are the retardance images in center and edge areas respectively. c) and d) are their corresponding intensity images in center and edge areas respectively. 1000 × 952 pixels display the physical size of 4 by 4 mm in the images. Note that the noise has been suppressed by a median filter and a mask in these retardance images, and solid dark blue areas are masked out due to poor SNR.

