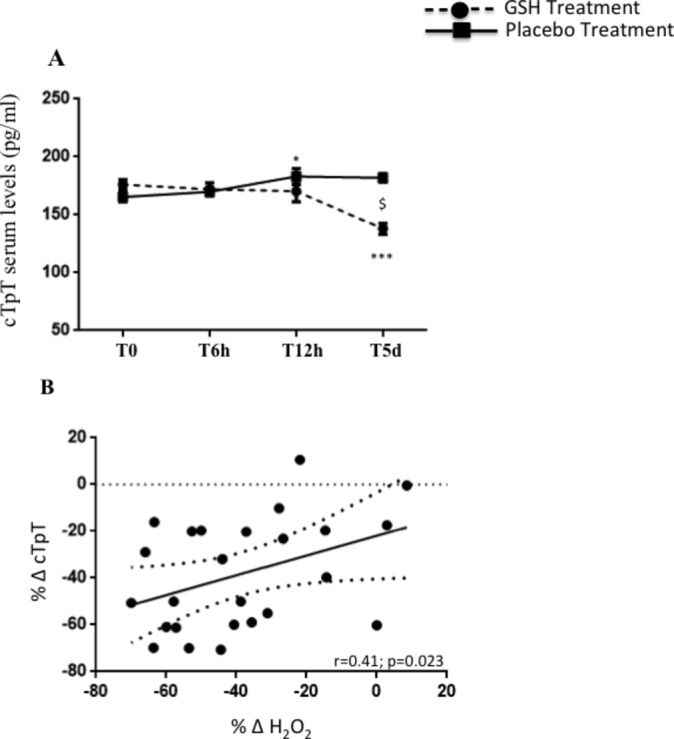
Figure 3.

cTpT levels (A) at baseline, after 6 hours (T6h), 12 hours (T12h) and at the 5 days (T5d) from the PCI in patients received GSH (n=25, dashed line) or placebo (n=25, continuous line). Data are expressed as mean±SEM (*P<0.05 vs T0, ***P<0.0001 vs T0, $P<0.05 between groups). Linear correlation between % Δ cTpT and % Δ H2O2 in GSH-treated group (B). cTpT, cardiac troponin T; H2O2, hydrogen peroxide; GSH, glutathione; PCI, percutaneous coronary intervention.
