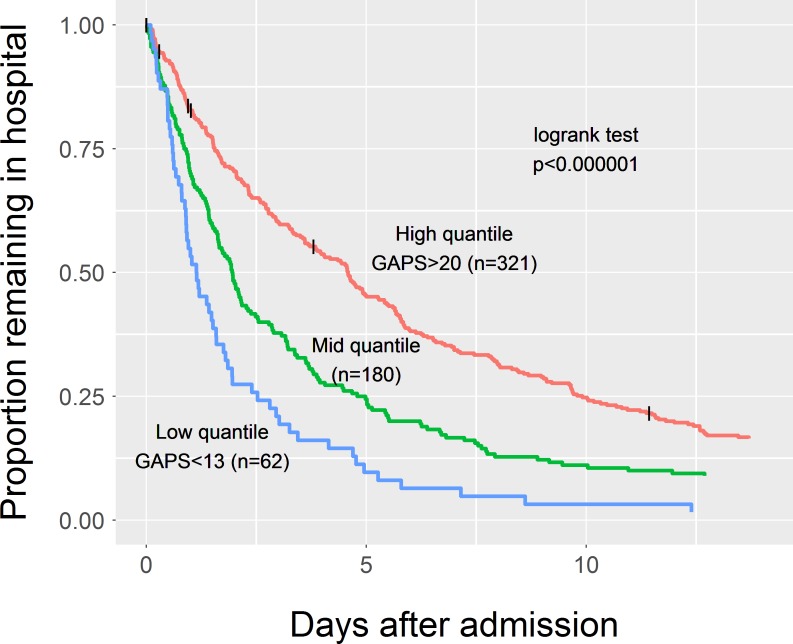
Figure 2.
Kaplan-Meier curve for inpatient length of stay. The data are split into three equal quantiles of low, medium and high GAPS shown by the three separate curves. An increase in GAPS is associated with a longer inpatient length of stay. The logrank test p value indicates that the difference in survival between the quantiles is statistically significant. GAPS, Glasgow Admission Prediction Score.

