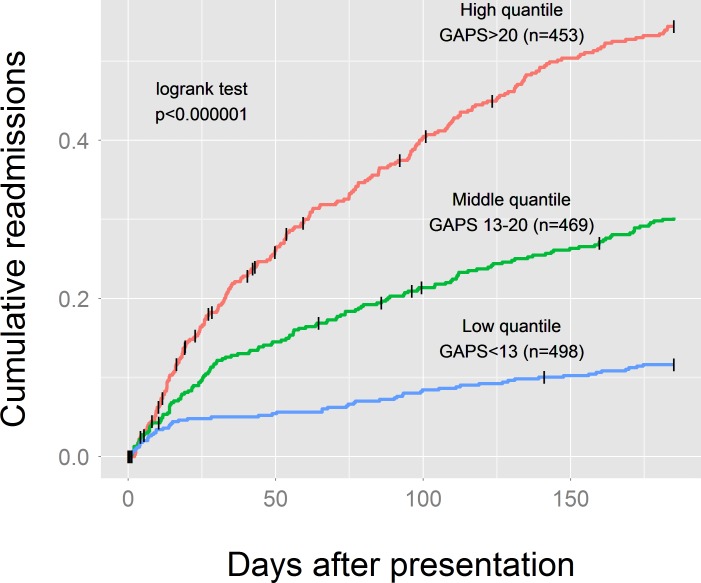
Figure 3.
Kaplan-Meier curve for 6-month readmission. The data are split into three equal quantiles of low, medium and high GAPS shown by the three separate curves. An increase in GAPS is associated with a higher chance of 6-month hospital readmission. The logrank test p value indicates that the difference in survival between the quantiles is statistically significant. GAPS, Glasgow Admission Prediction Score.

