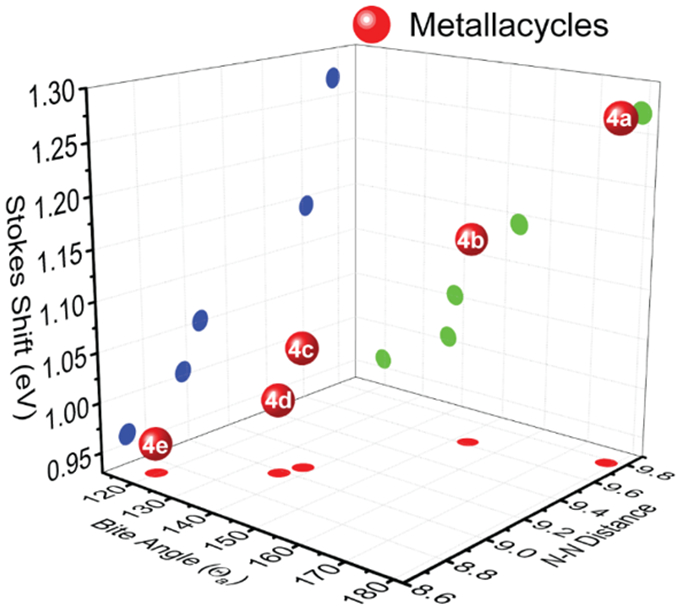
Figure 7.

3-D plot figure of the DPAC-cored metallacycles, in which bite angle (Θa), N-N distance (Å), and Stokes shift (eV) were recorded as X, Y and Z axis, respectively. Red, blue, and green circles denote the projections on XY, YZ, and XZ planes, respectively.
