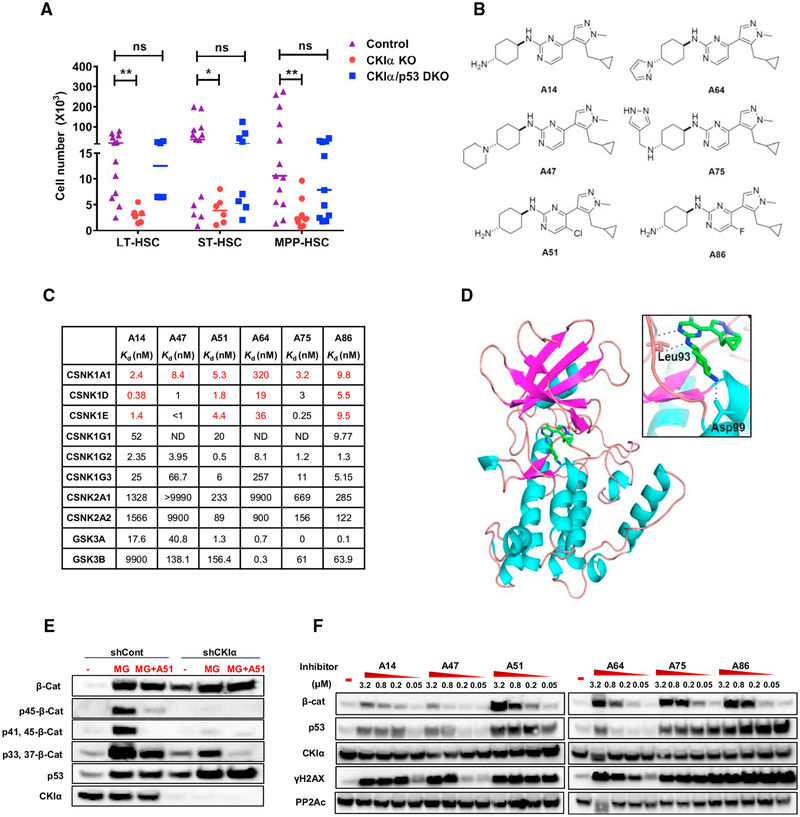
Figure 1. Development of Small Molecule CKI Inhibitors.
(A) FACS analysis of BM HSC populations from CKIαfl/fl Mx1-Cre (CKIα KO), CKIαfl/fl Mx1-Cre/p53KI/KI (CKIα/p53, DKO), or CKIαfl/+ Mx1-Cre (Control), 7 days post initial knockout induction with pIpC. LT-HSC, long term HSCs; ST-HSC, short term HSCs; MPP, multipotent progenitor cells. Graph shows individual mouse data and mean; statistical analysis by Mann-Whitney test, N ≥ 6 for all groups.
(B) Structures of selected A-series CKI inhibitors.
(C) Binding constant (Kd) values of selected A-series inhibitors to members of the CKI (CSNK1), CK2 (CSNK2), and GSK3 (GSK3) families, measured Kd are shown in red and estimated Kd values (calculated based on percent control [%Ctrl]) are shown in black.
(D) Crystal structure of CKIα in complex with A86. CKIα shown as a cartoon representation, A86 as a stick representation (green, C and H atoms; blue, N atoms; gray, F atoms). Inset: ATP binding pocket showing the interacting residues Leu93 and Asp99 forming hydrogen bonds (blue dashed lines) with A86.
(E) Western blot (WB) analysis of β-catenin (β-Cat) phosphorylation in RKO cells, CKIα depleted (shCKIα), or shControl cells treated with 1 μM A51 for 18 hr. Proteasome inhibitor (MG132, 20 μM) was added 4 hr before cell harvesting.
(F) WB analysis of RKO cells treated for 18 hr with A-series inhibitors at the indicated concentrations or with DMSO (control). PP2Ac is a loading control.
See also Figure S1.

