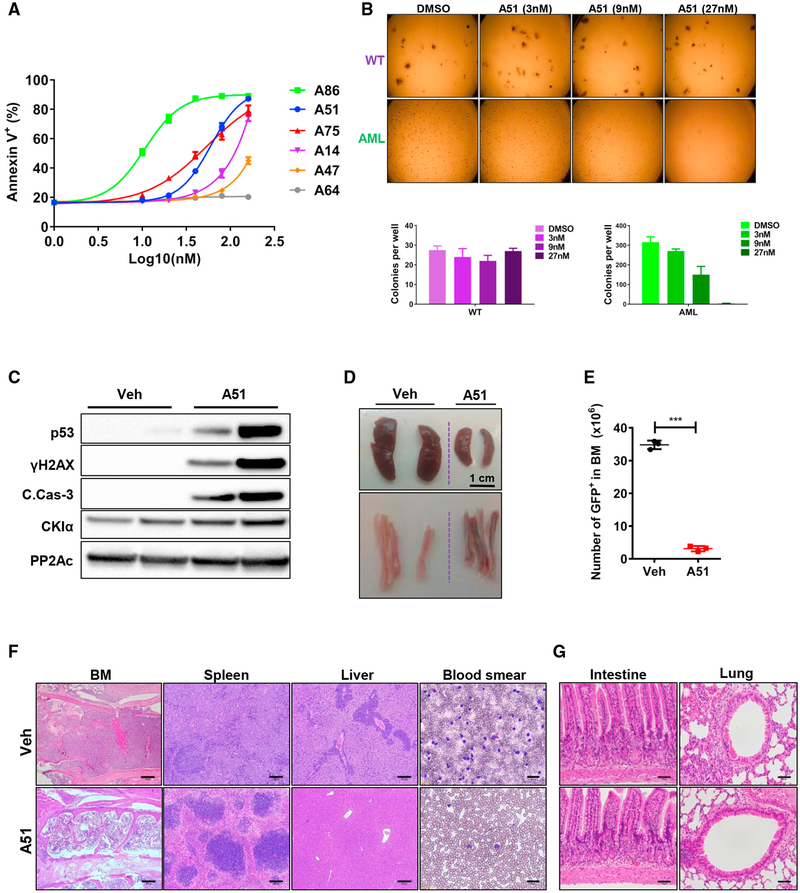
Figure 2. Selective Anti-leukemic Activity of Prototype CKI Inhibitors.
(A) Primary BM cells from MLL-AF9- AML sick mice treated for 18 hr with the indicated inhibitors. FACS analysis; shown is the percentage of Annexin V-positive apoptotic cells in response to the indicated inhibitor concentration (log10). y axis intersection corresponds to DMSO control. Experiment performed in triplicates; for each inhibitor concentration, data are presented as mean ± SD.
(B) Images and quantification of colony forming unit (CFU) assay using primary BM cells isolated from WT or advanced MLL-AF9-driven AML mice, treated ex vivo with DMSO or A51 at the indicated concentrations. Shown is a representative experiment (N = 3), all performed in duplicates. Quantification of CFUs (mean ± SD) is shown below.
(C) WB analysis of BM cells isolated from leukemic mice treated for 6 hr with A51 (10 mg/kg) or vehicle. PP2Ac, a loading control.
(D) Representative images of spleen (top), tibia, and femur (bottom) from AML mice treated with vehicle or a single dose of A51 (20 mg/kg) for 16 hr.
(E) Absolute numbers of GFP+ leukemia blasts in BM from AML mice treated with a single oral dose of A51 (20 mg/kg) or vehicle for 16 hr. Graphs show mean ± SD values, N ≥ 3 for all groups.
(F and G) Representative H&E-stained tissue sections (scale bar, 200 μm for F and 50 μm for G) and blood smear (scale bar, 30 μm) of affected (F) and unaffected (G) tissue from AML mice treated with a single dose of A51 (20 mg/kg) or vehicle for 16 hr.
See also Figure S2.

