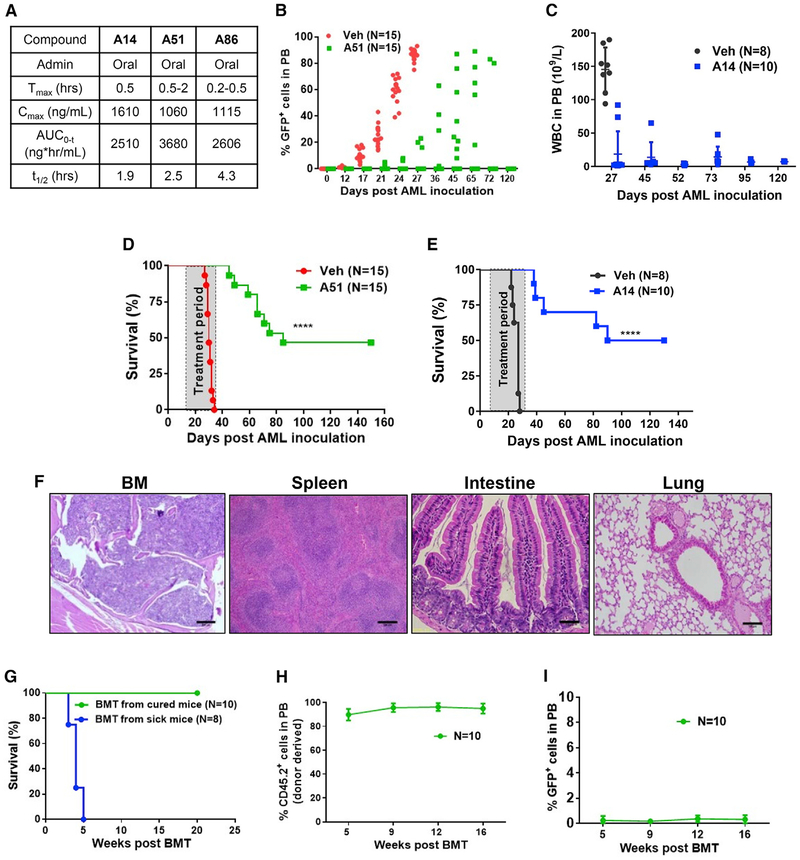
Figure 3. Long-Term Therapeutic Effects of CKI Inhibitors in AML Mouse Model.
(A) Pharmacokinetic (PK) analysis in CD-1 mice treated orally (20 mg/kg) with the indicated CKI inhibitors.
(B) Percentage of GFP+°leukemic blasts in PB over time of individual leukemia-inoculated mice treated with A51 (N = 15) or vehicle (N = 15). A51 treatment (5 mg/kg/day) started at day 8 post leukemia inoculation and continued once daily for 3 weeks (6 days/week).
(C) White blood cells (WBC) counts in PB over time post leukemia inoculation of A14 (N = 10) or vehicle-treated mice (N = 8). A14 treatment (10 mg/kg/day) started at day 4 post leukemia inoculation and continued once daily for 4 weeks. Graphs show mean ± SD values.
(D) Kaplan-Meier survival curve of AML mice, treated with A51 (5 mg/kg/day), or vehicle. Statistical analysis was done with log-rank (Mantel-Cox) test; p value < 0.0001.
(E) Kaplan-Meier survival curve of A14-treated (N = 10) or vehicle-treated (N = 8) AML mice. A14 treatment (10 mg/kg/day) started at day 4 post leukemia inoculation and continued once daily for 4 weeks. Statistical analysis was done with log-rank (Mantel-Cox) test; p value < 0.0001.
(F) Representative H&E stained tissue sections of A51-treated, long-term surviving mice (same experiment as B and C, tissue section taken 5 months post AML inoculation). Scale bars, 200 μm (BM and spleen); 100 μm (Intestine and lung).
(G) Kaplan-Meier survival curve of lethally irradiated WT recipient mice transplanted with BM pooled from A51-treated cured donor mice (N = 10 recipients) or from sick mice (N = 8 recipients); Donor BM cells were pooled from three A51-treated, cured (green), or sick (blue) mice.
(H) %CD45.2+ donor-derived cells in the PB of lethally irradiated WT recipient mice (N = 10) transplanted with BM from A51-cured mice, 16 weeks post transplantation. Graphs show mean ± SD values.
(I) %GFP+ leukemia blasts in PB of lethally irradiated recipient mice transplanted with BM isolated from A51-cured mice 16 weeks post transplantation. N = 10 and graphs show mean ± SD values.
See also Figure S3.

