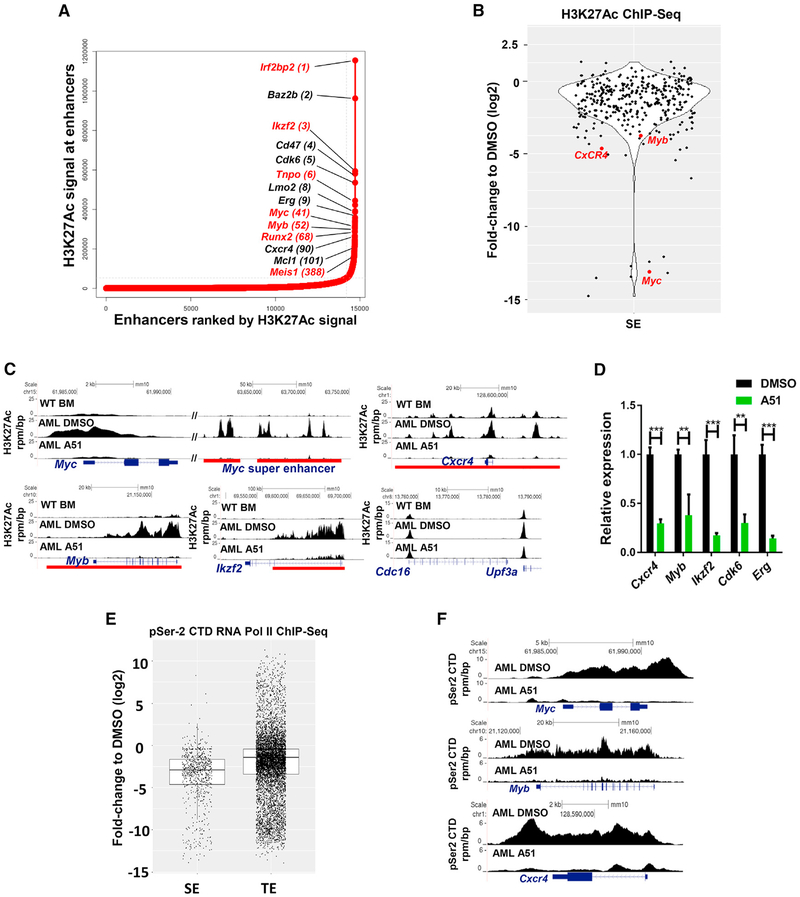
Figure 5. Blocking CDK7&9 Disrupts Leukemia SEs and Halts the Transcription Elongation of SE-Driven Leukemia Oncogenes.
(A) Ranking plot of enhancers identified in AML BM cells, ranked by increasing H3K27Ac signal (units: rpm). Super-enhancers (SE) are defined as enhancer clusters, excluding signals at the promoter, ranked above the inflection point of the curve. Absolute SE gains are represented in red.
(B) Quantification of log2 fold changes of H3K27Ac ChIP-seq signals of all the SEs identified in A51 (1 μM, 4hr) versus DMSO-treated AML cells.
(C) Gene tracks of H3K27Ac ChIP-seq signals at selective loci from BM cells isolated from WT and from AML mice treated ex vivo with DMSO or A51 (1 μM) for 4 hr. Red bars indicate SEs identified in DMSO-treated AML cells. The Cdc16-Upf3a locus represents a typical enhancer. y axis shows ChIP-seq signal (rpm/bp). x axis depicts genomic position.
(D) qPCR mRNA expression analysis of indicated genes in primary AML cells treated ex vivo with A51 (1 μM, 4 hr) or DMSO (N = 3, Student’s t test). Graphs show mean ± SD values.
(E) pSer2 CTD ChIP-seq analysis of SEs versus typical enhancers (TE) in primary AML cells treated with A51 (1 μM, 4 hr) relative to DMSO. p values according to Welch’s two-tailed t test is <2.2e – 16. Central rectangle shows the first quartile to the third quartile with median.
(F) Individual gene tracks of pSer2 CTD signals at indicated loci of DMSO- or A51 (1 μM, 4 hr)-treated cells (same experiment as E). y axis shows ChIP-seq signal (rpm/bp). x axis depicts genomic position.
See also Figure S5.

