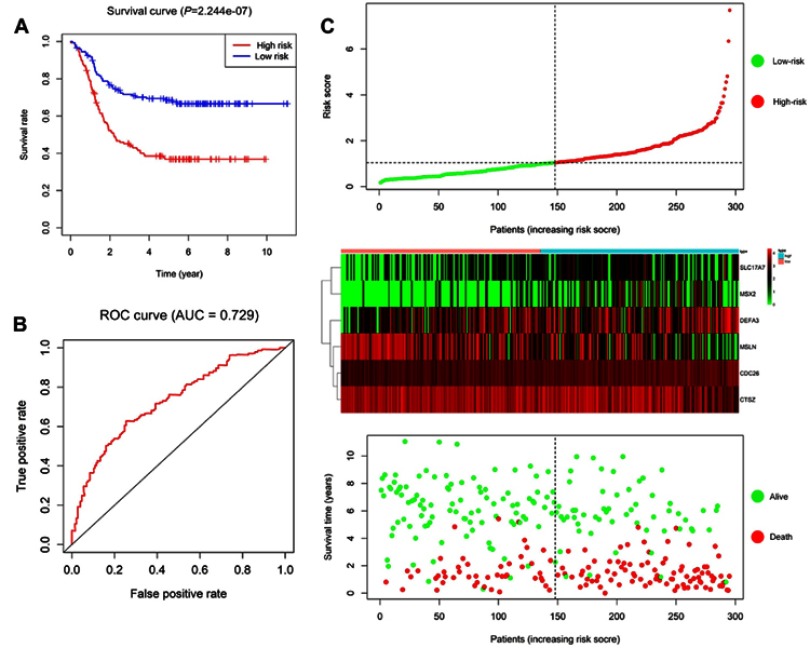
Figure 6.
Prognostic risk score model analysis of six prognostic genes. (A) The Kaplan–Meier curves for low-risk and high-risk groups. (B) The ROC curves for predicting OS by the risk score. (C) The distribution of risk score, expression heat map, and survival status.
Abbreviations: AUC, area under the curve; ROC, receiver operator characteristic; OS, overall survival.

