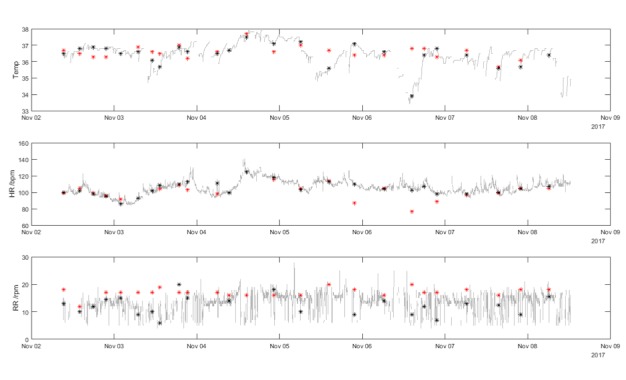
Figure 2.

Vital signs data for a single participant. The grey lines show the minute-by-minute vital sign values from the SensiumVitals patch. The black markers show the median value of the SensiumVitals vital signs (evaluated from ±10 mins of the nurse observation time). The red markers show the manually recorded vital signs. Where there is a wide difference between the red and black markers at a single time point, this indicates disagreement between the two vital signs measurement techniques. HR, heart rate; RR, respiratory rate; Temp, temperature.
