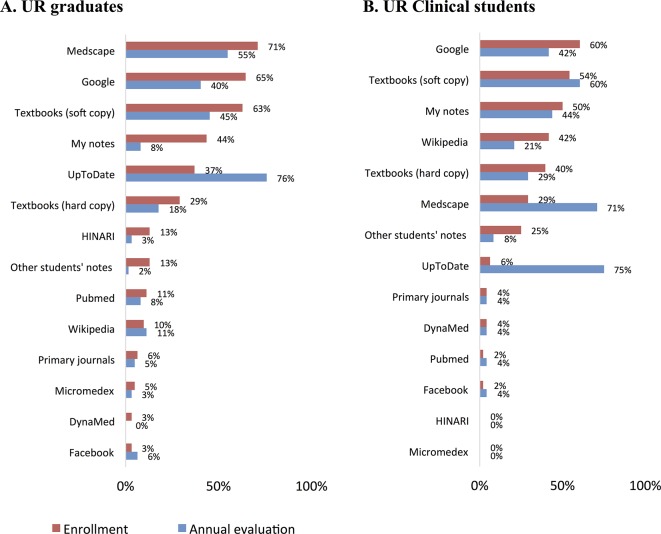
Figure 3.
Changes in the usage of electronic resources. Figures show the percentage of respondents who reported using a particular resource ‘almost every day’ at enrolment and 1 year later at the time of annual evaluation. Shading added to highlight responses for UpToDate. (A) Responses of UR users who had graduated at the time of annual evaluation and were practising physicians. (B) Responses of UR clinical students (Doc1 at the time of enrolment) who were still in school at the time of annual evaluation. n=62 UR graduates, and 66 UR students. UR, University of Rwanda.

