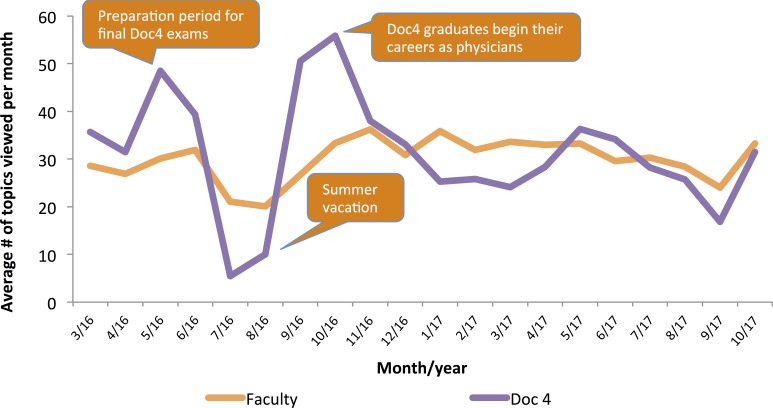
Figure 5.
EBCR utilisation over time by UR students and faculty. Lines show the average number of topics viewed per user per month by each user group. Only users who enrolled before 01 March 16 are included in this analysis (n=185 faculty, 70 Doc4 students). Call-outs are added to describe events in the careers of Doc4 students.

