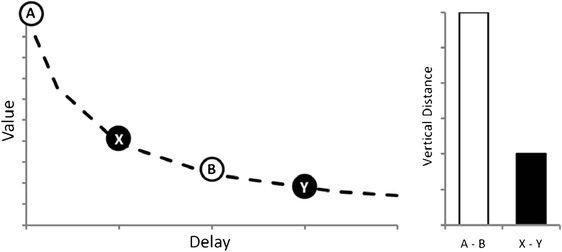
Fig. 1.

Comparison of value decay from different points of the hyperbolic function for equivalent delays. Points A and B represent immediate and delayed primary rewards, respectively. Points X and Y represent immediate (already discounted by the exchange period) and delayed conditioned rewards (e.g., money or token), respectively. The left panel illustrates the coordinates of each point, whereas the right panel shows the difference in value induced by equivalent delays within different types of rewards. Note that even when the horizontal distance from A to B is equal to that from X to Y, the vertical distance between the former points is about 3 times greater than that between the latter
