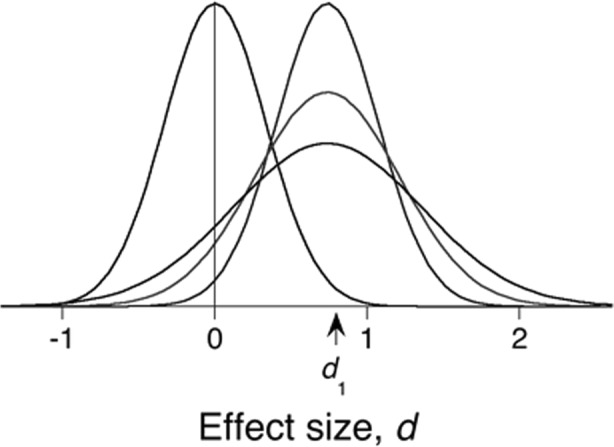
Fig. 2.

The tallest density centered on d1 is a sampling distribution for a measured variable (z) or effect size (d). In the latter case it gives the predicted distribution of mean effect sizes in replications if the true effect size, δ, equals the recorded effect size d1. The tail to the left of the origin gives the probability of getting a mean of d1 if the population parameter were of opposite sign: this is another interpretation of the p-value. Because we do not know that δ precisely equals d1—both the initial and study and the duplicate incur sampling error—the variance of the distribution is increased (doubled in the case of an equal-powered replication), to create the posterior predictive distribution (ppd), the intermediate distribution on the right. In the case of a conceptual rather than strict replication, additional realization variance is added, resulting in the lowest ppd. In all cases, the area under the ppds to the right of the origin gives the probability of supportive evidence in replication (prep). Shifted to the left over 0, the tallest density gives the distribution of mean effect sizes under the null hypothesis
