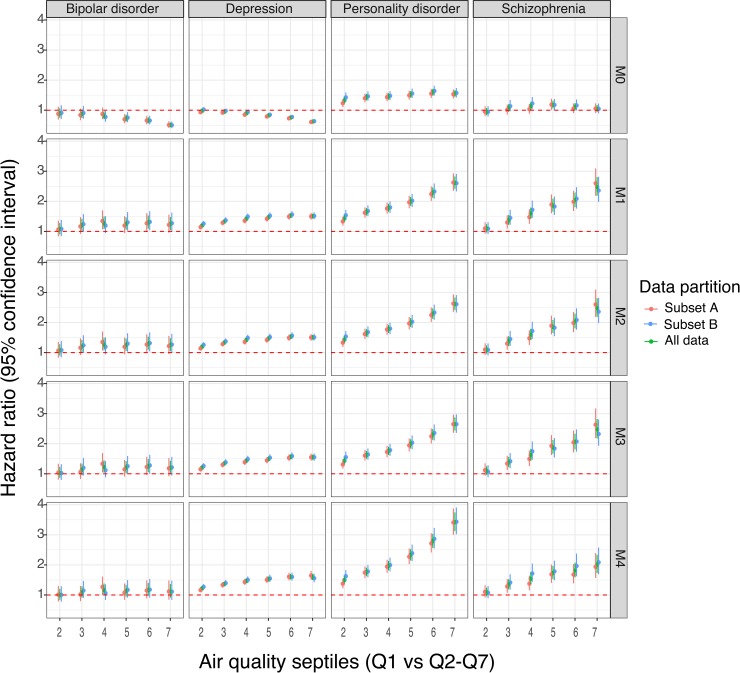
Fig 4. Association between air quality and the risk of psychiatric disorders in Denmark.
The results from the Danish data analysis in which the individual-level estimates of air quality exposure are divided into septiles, with each septile representing approximately 200,000 individuals. Septile 1 (representing the least exposure) is used as a referent to compare disorder rates in the higher septiles for bipolar disorder, schizophrenia, personality disorder, and major depression. Higher septiles represent individuals with systematically higher exposure to low-quality air. Five different models (labelled M0–M4) were run for each phenotype, briefly as follows: M0: crude model with 7 air-quality–exposure groups; M1: M0 + calendar time using splines; M2: M1 + sex; M3: M2 but restricted to subset of population with no missing covariates; and M4: M3 + socioeconomic status + urbanization. Further, to cross-validate the models, whole data were split into 2 equal subsets (subset A and subset B), separate models were run on each subset, and the parameter estimates were compared. The figure shows estimates from subset A, subset B, and from the model using all the data. The underlying data for this figure can be found in S4 Table.

