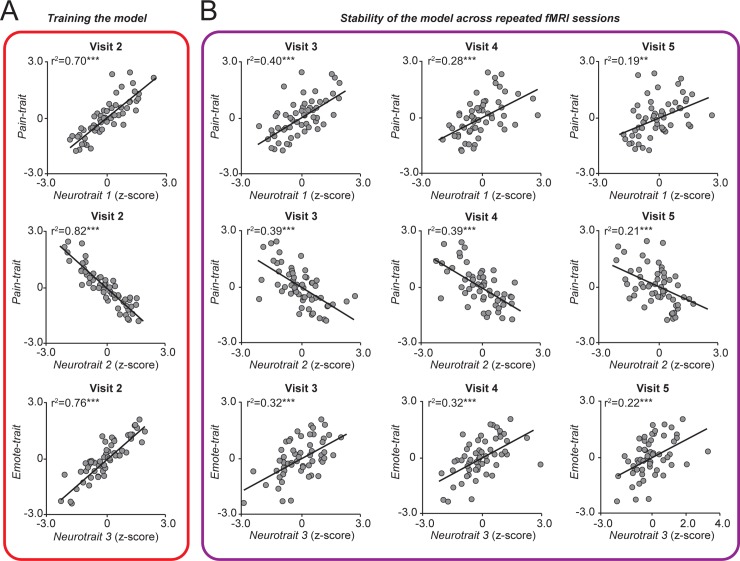
Fig 4. Stability assessment of neurotraits from repeat brain scans over 5 weeks.
A. Strength of relationships between weighted patterns of connectivity that were trained at V2 with corresponding psychology/personality trait scores. B. Relationship between neurotraits (derived from connectivity based on subsequent brain scans) and trait scores determined by questionnaires at V1. The trait–neurotrait relationship is preserved. *P < 0.05; **P < 0.01; ***P < 0.001. For each figure, the numerical data are available S1 Data, and a description of the analyses and P values are reported in S4 Table.

