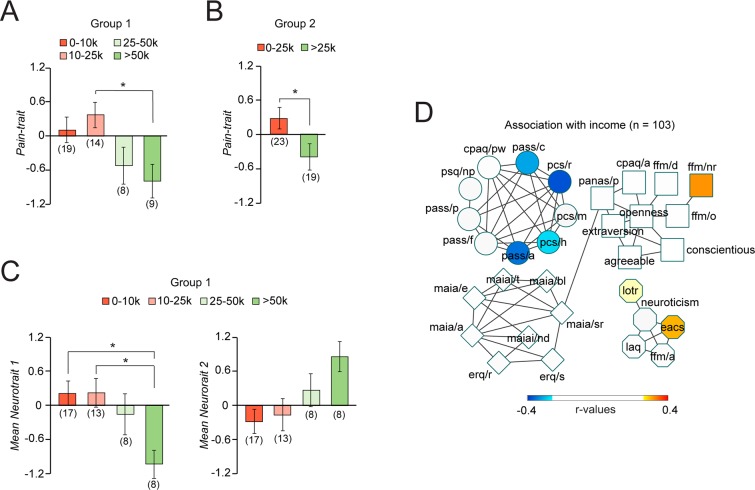
Fig 6. Association between socioeconomic factors and traits and neurotraits.
A. Income differentiated patients on Pain-trait after controlling for ethnicity and years of education (while the inverse was not true), suggesting that socioeconomic status (rather than ethnicity or years of education) contributed to Pain-trait 1. Annual income of >25,000 seemed to represent a socioeconomic threshold distinguishing vulnerability from protection. B. Applying the 25,000 threshold yielded similar results in Group 2. C–D. Self-reported income further differentiated Neurotrait 1 and Neurotrait 2 (marginally significant; P = 0.06). E. Spearman correlations were used to display subscales associated with income (only significant relations are displayed (uncorrected P < 0.05). All abbreviations are defined in Fig 1. Post-hoc comparisons were Bonferroni corrected for six comparisons &P ≤ 0.1; *P < 0.05. For each figure, the numerical data are available S1 Data and a description of the analyses and p-values are reported in S4 Table.

