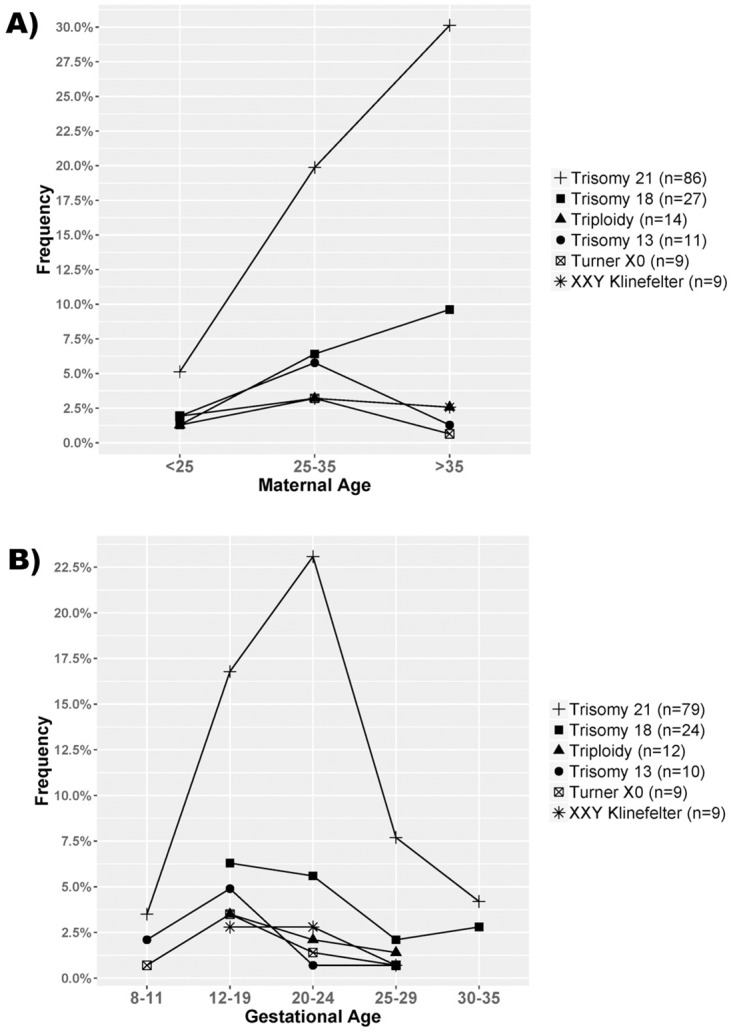
Fig 3. Graphical presentation of the proportions of maternal age and gestational age at diagnosis among the six most frequent types of aneuploidy.

A) Distribution of the proportions of the maternal age aggregated in three different groups. The "y" axis shows the frequency of each group relative to the total number of aneuploidies (n = 156) with available data for MA. B) Distribution of the proportions of the gestational age aggregated in five different groups. The "y" axis shows the frequency of each group relative to the total number of aneuploidies (n = 143) with available data for GA.
