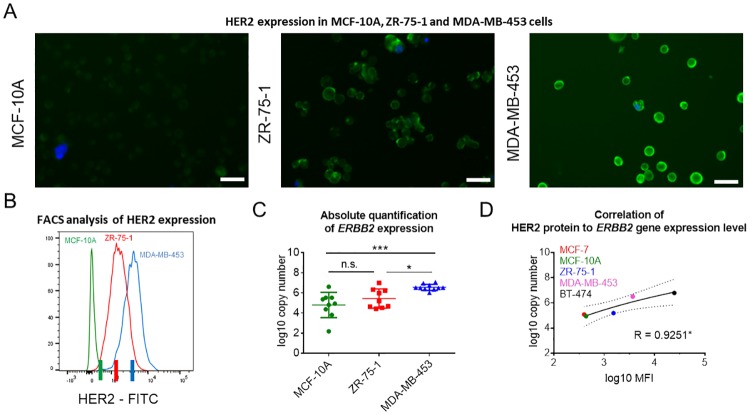
Fig 3. Highly accurate analysis of differential expression facilitated by the new qPCR assay.
HER2 expression analysis in three breast cancer cell lines (MCF-10A, ZR-75-1 and MDA-MB-453) assessed microscopically (A) and by flow cytometry (B). (A) Brightness: +20%, contrast: -40%. Scale bar indicates 20 μm. (B) Median FITC (MCF-10A) = 436; Median FITC (ZR-75-1) = 1,529; Median FITC (MDA-MB-453) = 3,575; 3.5-fold (MCF-10A vs. ZR-75-1) and 2.3-fold (ZR-75-1 vs. MDA-MB-453) increase in HER2 expression levels. Colored lines on the x-axis indicate the signal intensities used as thresholds for sorting of cell populations prior to single-cell isolation and analysis. (C) Quantification of ERBB2 expression at the single-cell level was conducted following the newly established protocol (Fig 2C). Cp values were converted to log10 copy numbers using an external standard curve. Mean ± SD; Tukey’s multiple comparisons test was applied, n.s. = not significant, * p<0.05, ** p<0.001. (D) Correlation between measured HER2 protein and ERBB2 gene expression levels. Log10 converted median fluorescent intensity (MFI) values derived from FACS analysis and log10 converted copy numbers calculated using the absolute quantification method are plotted. Pearson’s correlation coefficient R, * p<0.05.

