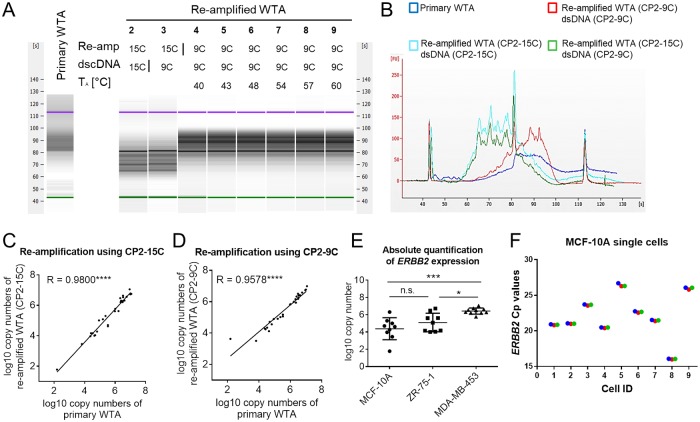
Fig 4. Single-cell qPCR analysis utilizing re-amplified WTA products.
(A,B) Fragment size distribution of primary WTA and corresponding WTA re-amplification products (generated with either the CP2-15C or the CP2-9C primer) of one representative BT-474 single cell assessed by Bioanalyzer assay. (A) 2–9: Re-amplified WTA products generated using the indicated primer sequence for re-amplification and dscDNA-synthesis. 4–9: Samples re-amplified with different annealing temperatures (TA). (B) Electropherogram of selected samples. (C,D) Correlation between qPCR results conducted with primary and re-amplified WTA using CP2-15C (C) and CP2-9C (D) primers for re-amplification. (E) Absolute quantification of ERBB2 transcript levels in MCF-10A, ZR-75-1 and MDA-MB-453 cells using re-amplified single-cell WTA products (generated using the CP2-9C primer). (F) Cp values of ERBB2 expression generated for MCF-10A single cells after re-amplification using CP2-9C primer. Red, green and blue represent three different replicates.

