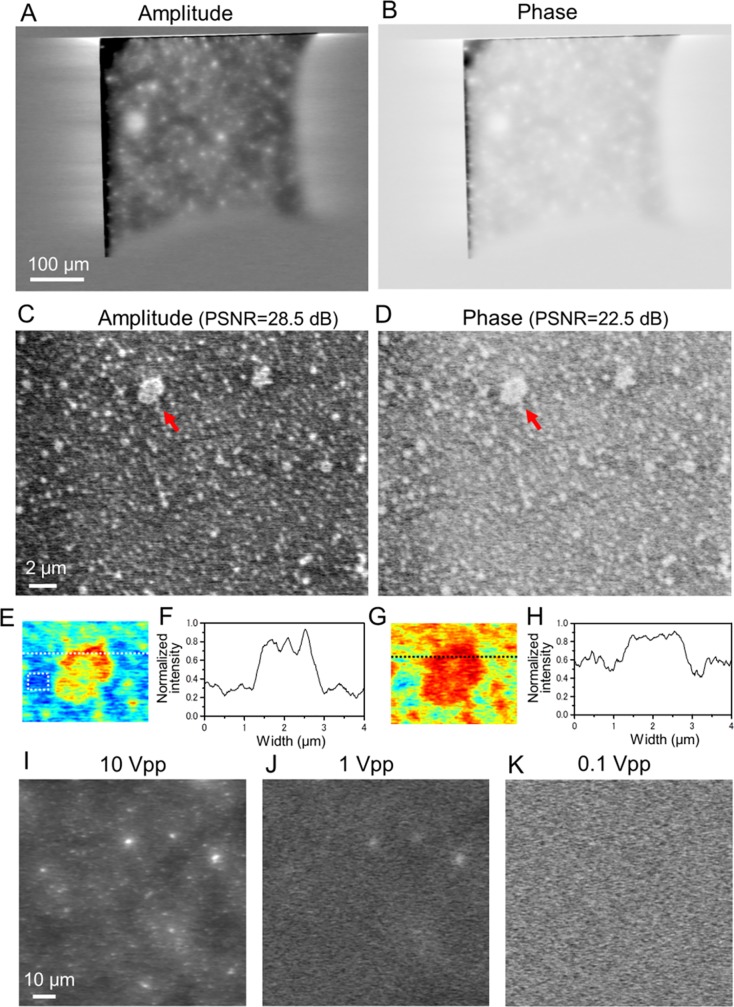
Fig 3. Amplitude and phase images of PLA beads in water observed by the IP-SEM system.
(A) and (B): Amplitude (A) and phase (B) images of 500 nm-diameter PLA beads in water, simultaneously obtained from the lock-in amplifier (EB acceleration voltage 7 kV, EB current 300 pA, input frequency 50 kHz, magnification 200×). The large white particles in (A) are bead aggregates. (C) Amplitude image of the PLA beads in water at high magnification (5,000×). The white particles (500 nm-diameter beads) are dispersed over the whole area. PSNR of this image is 28.5 dB, which is calculated by the beads aggregation area and no-beads area using Eq (1). (D) Simultaneously obtained phase image. PSNR is 22.5 dB. (E) An expanded pseudo-colour map of the aggregation beads indicating a red arrow in (C). The noise level of MSE was measured at the no-beads area in the white square. (F) Line plots of the aggregation beads along the white dotted lines in (E). (G) An expanded pseudo-colour map of the aggregation beads indicating a red arrow in (D). (H) Line plots of the black dotted lines in (G). (I) Amplitude image of the beads at 10 Vpp sine wave input, (magnification 500×, input frequency 50 kHz, EB accelerating voltage 7 kV). The white beads are clearly observed. (J) Amplitude image of the beads at 1 Vpp. The contrast of the white beads is decreased. (K) Amplitude image of the beads at 0.1 Vpp. The white beads have completely disappeared. These amplitude images were reversed contrast. Scale bars: 100 μm in (A), 2 μm in (C) and 10 μm in (I).

