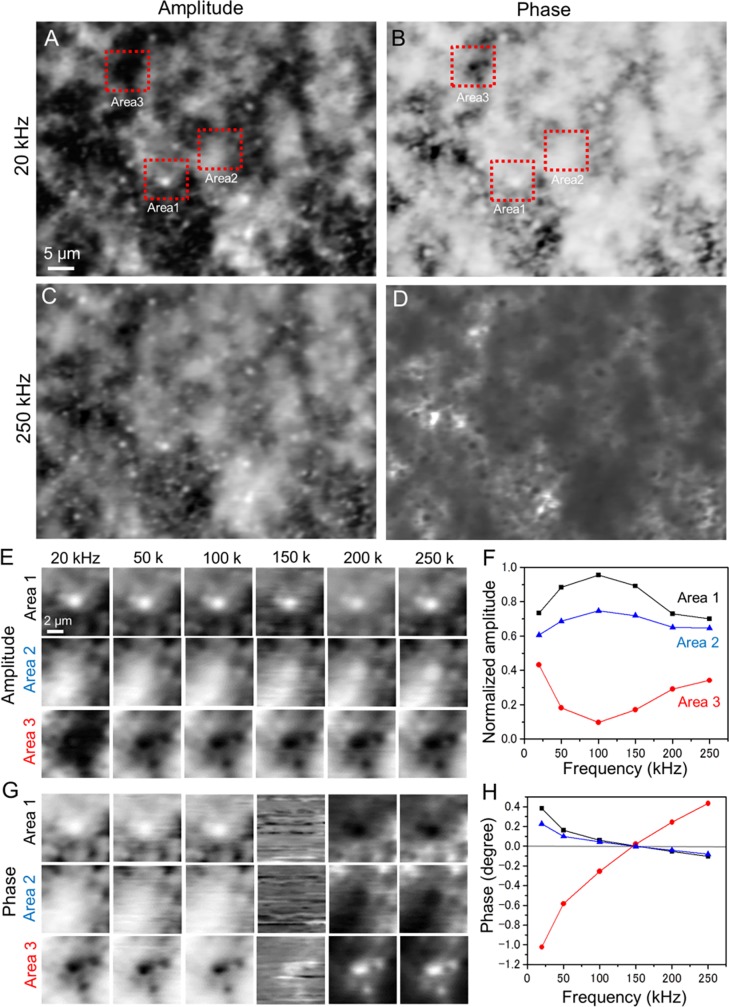
Fig 5. Amplitude and phase images of whole-milk sample in liquid conditions observed by the IP-SEM system.
(A) Amplitude image of the whole-milk sample (input frequency 20 kHz, EB accelerating voltage 7 kV, EB current 500 pA, magnification 1,000×). Black and white particles appear within a white cloud-like structure. (B) Simultaneously obtained phase image. (C) Amplitude image of the area scanned in (A) with a 250-kHz input signal (other conditions unchanged). These amplitude images were reversed contrast. (D) Simultaneously obtained phase image. (E) Amplitude images of the white and black particles in Areas 1–3 in (A) obtained at various input frequencies of 20–250 kHz. The white particle is insensitive to input frequency in Area-1, but fades with increasing frequency in Area-2. (F) Normalised amplitude versus input frequency for the white and black particles in the centres of Areas 1–3 in (E). (G) Phase images of the white and black particles in Areas 1–3 in (B) obtained at various input frequencies. The phase contrast reverses above 150 kHz. (H) Phase versus input frequency for the white and black particles in the centres of Areas 1–3 in (G). The phase lines cross the 0° line at 150 kHz. Scale bars: 5 μm in (A) and 2 μm in (E).

