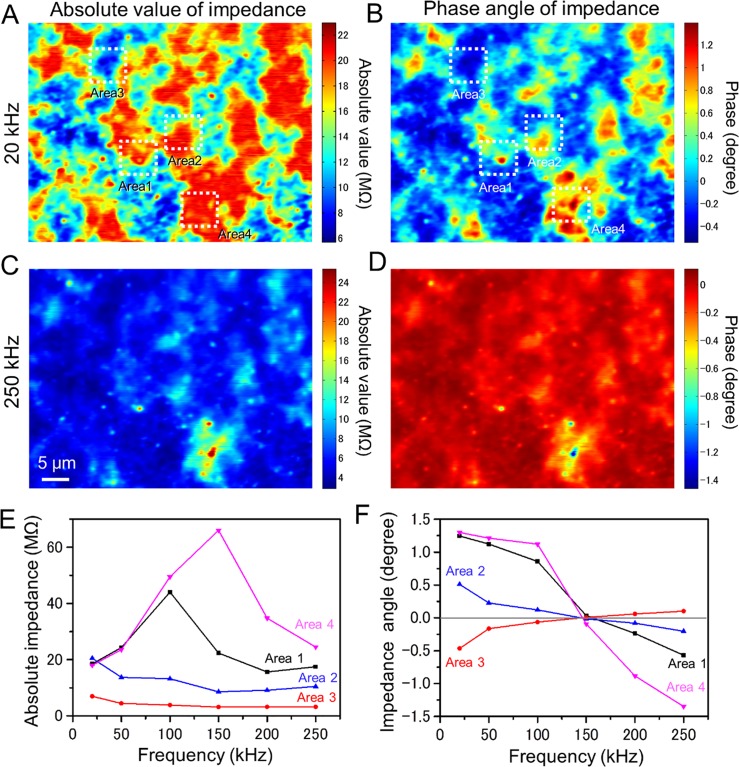
Fig 6. The impedance amplitude and phase colour maps of the whole milk sample.
(A) A colour map of absolute impedance of the whole milk sample (EB accelerating voltage 7 kV, EB current 400 pA, input frequency 20 kHz, magnification 1,000×). The impedance range in map is 6–22 MΩ. (B) Simultaneously obtained an impedance phase map. (C) Amplitude map of the same area scanned in (A) with a 250-kHz input signal (other conditions unchanged). The impedance range of its map is expanding to 4–25 MΩ. (D) Simultaneously obtained an impedance phase map. (E) The absolute impedance versus input frequency of the white and black particles in the centres of Areas 1–4 in (A). Areas 1 and 4 shows sharp peak at 100 kHz and 150 kHz input frequency. By contrast, the amplitude of Area-2 shows almost flatten in whole frequency. (F) A frequency characteristic of phase at the white and black particles in the centres of Areas 1–4. Scale bar, 5 μm in (C).

