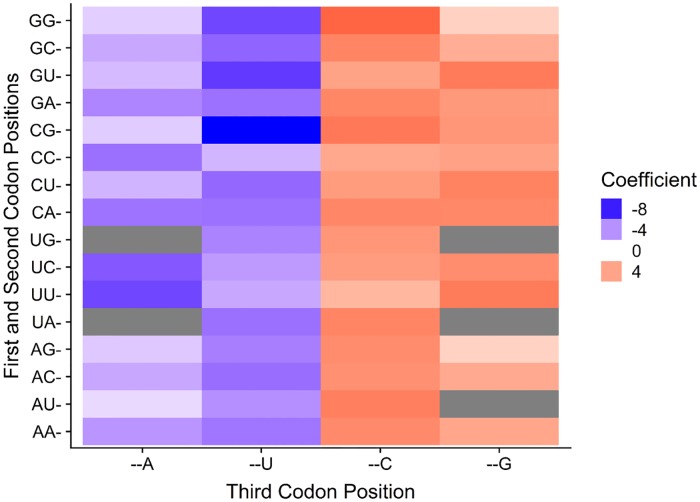
Fig 3. The high correlation between codon usage and GC composition of the third codon position suggests that codon usage bias at the level of individual codons is likely driven by genetic drift.
The graph illustrates a phylogenetic generalized least squares comparison between relative synonymous codon usage values and third codon position GC composition (GC3) for each codon across the 327 budding yeast species. Colors toward the red spectrum indicate a positive correlation between CG-ending codons and increasing GC3. Blue colors indicate a negative correlation between A/U-ending codons and increasing GC3. Grey cells denote non-degenerate codons encoding methionine or tryptophan or stop codons.

