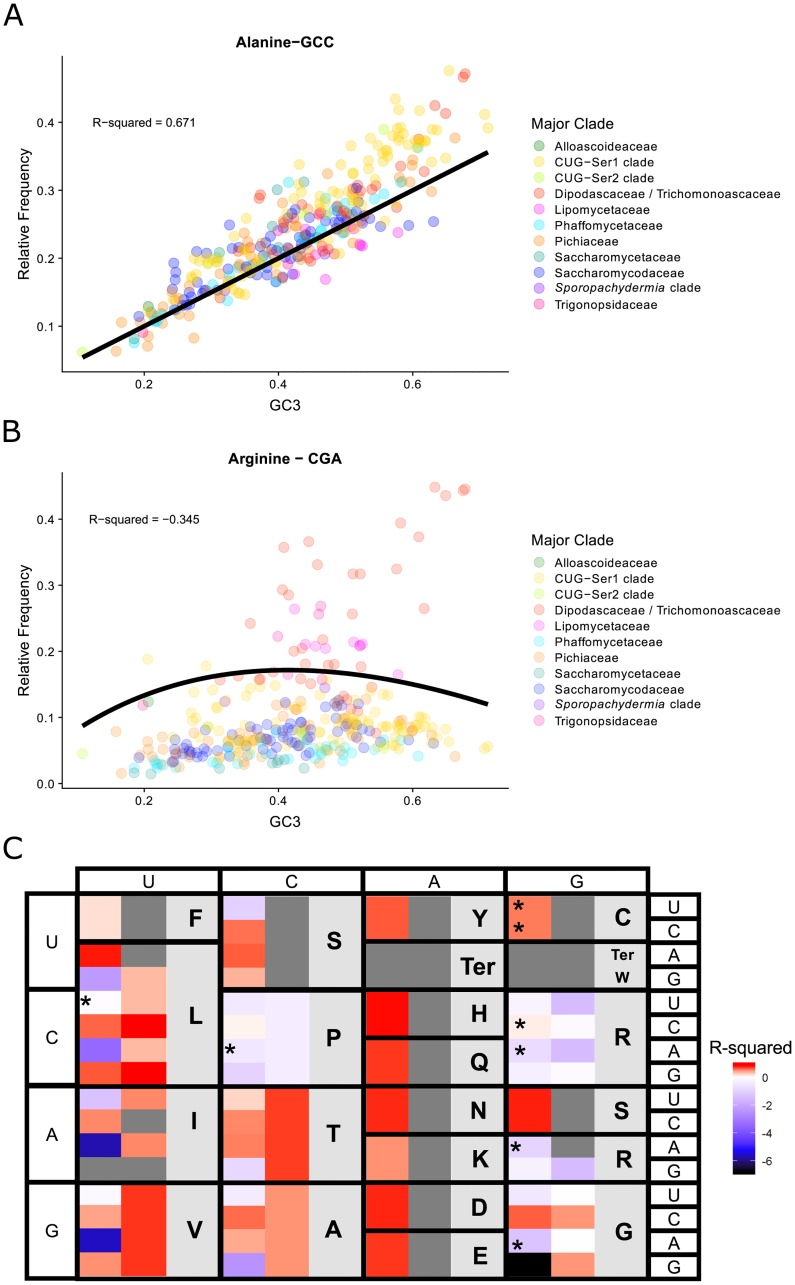
Fig 4. The complex relationship between relative frequency and genome-wide average base composition of the third codon position (GC3) suggests that individual codons vary in their fit to the neutral expectation (i.e., that codon usage is solely driven by GC mutational bias and genetic drift).
The neutral expectations for the different codons were obtained from the models developed by Palidwor et al. [38]. A) Observed relative frequency of the alanine codon GCC (shown on the Y axis) plotted against GC3(shown on the X axis) for each of the 327 budding yeast species analyzed in this study. The codon GCC had agood fit to the neutral expectation (black line, R-squared value = 0.671). B) Observed relative frequency of the arginine codon CGU plotted against GC3 composition for each species. The codon CGU had a poor fit to the neutral expectation (black line, R-squared value = -0.165); the same trend was also observed in the other Group-2 arginine codons (CGA and AGG). C) R-squared values for each of the codons (first column) and the sum of all codons for an amino acid (second column) compared to their neutral expectations. Boxes colored towards the red spectrum indicate a better fit to the neutral model, while boxes colored towards the blue spectrum indicate a poorer fit (i.e., worse than the mean) to the neutral model. Grey-colored boxes in the first column indicate non-degenerate amino acids or stop codons; grey boxes in the second column indicate codons that either have their own models (e.g., ATC) or have values that stem from the same model (e.g., all amino acids encoded by two codons, such as tyrosine (Y), which is encoded by TAT and TAC). Asterisks indicate codons with a Blomberg’s K variance over 1 when comparing GC3 and relative frequency, suggesting that the GC3 and relative frequency values for these codons are correlated due to phylogeny (i.e., closely related species tend to have more similar GC3 and relative frequency values due to shared ancestry).

