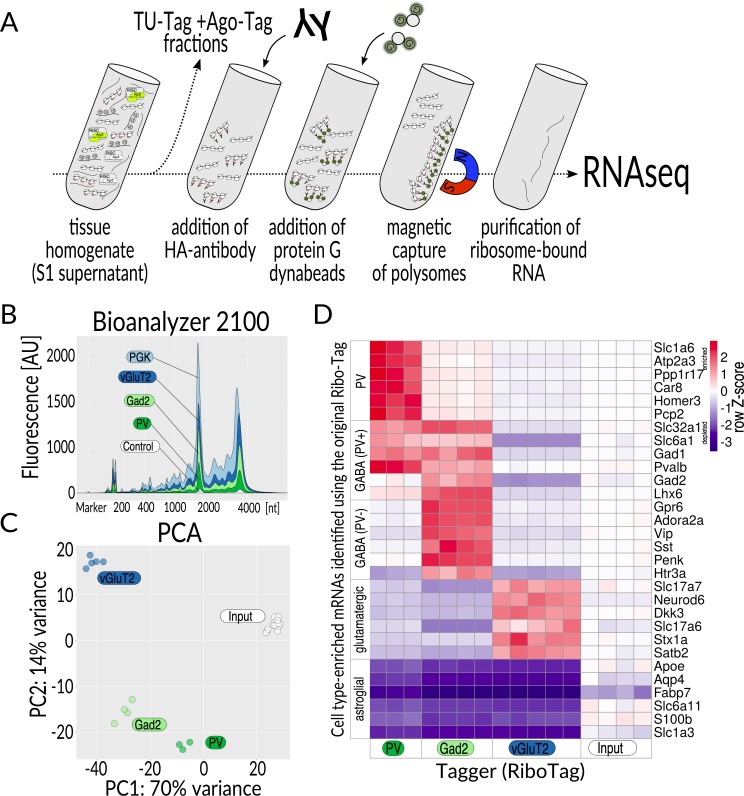
Fig 3. Ribo-Tag.
(A) Overview of the procedure. Tissue homogenate, following removal of nuclei and cell debris (S1 supernatant), is split into fractions for purifying specific classes of nucleic acids. To the fraction for Ribo-Tag, antibodies directed to the HA epitope are added, and the antigen-antibody complexes containing tagged ribosomes are enriched using protein G dynabeads. Eventually, RNA is released from protein G dynabeads, purified, and subjected to RNAseq. (B) Agilent bioanalyzer profiles of cell type–specific mRNA. Relative amounts of RNA correspond to the proportion of the analyzed cell population in the brain (color coded), determined by the Cre driver mouse line that was used (balloon labels, control = no Cre). (C) PCA of the data from three analyzed cell populations and input (S1 supernatant). (D) Heatmap showing relative distribution of Ribo-Tag (Tagger) TPM values for genes for cell type–enriched mRNAs selected based on data obtained with the original RiboTag mouse [10]. Each column represents one biological replicate. Z-score for each row was calculated to set the input levels to 0: Z = (x–mean(input))/SD(row), where SD is standard deviation. The complete set of TPM values on which panel D is based can be found in S1 Data. AU, arbitrary unit; Cre, causes recombination; HA, hemagglutinin; PCA, principal component analysis; RNAseq, RNA sequencing; TPM, transcripts per million.

