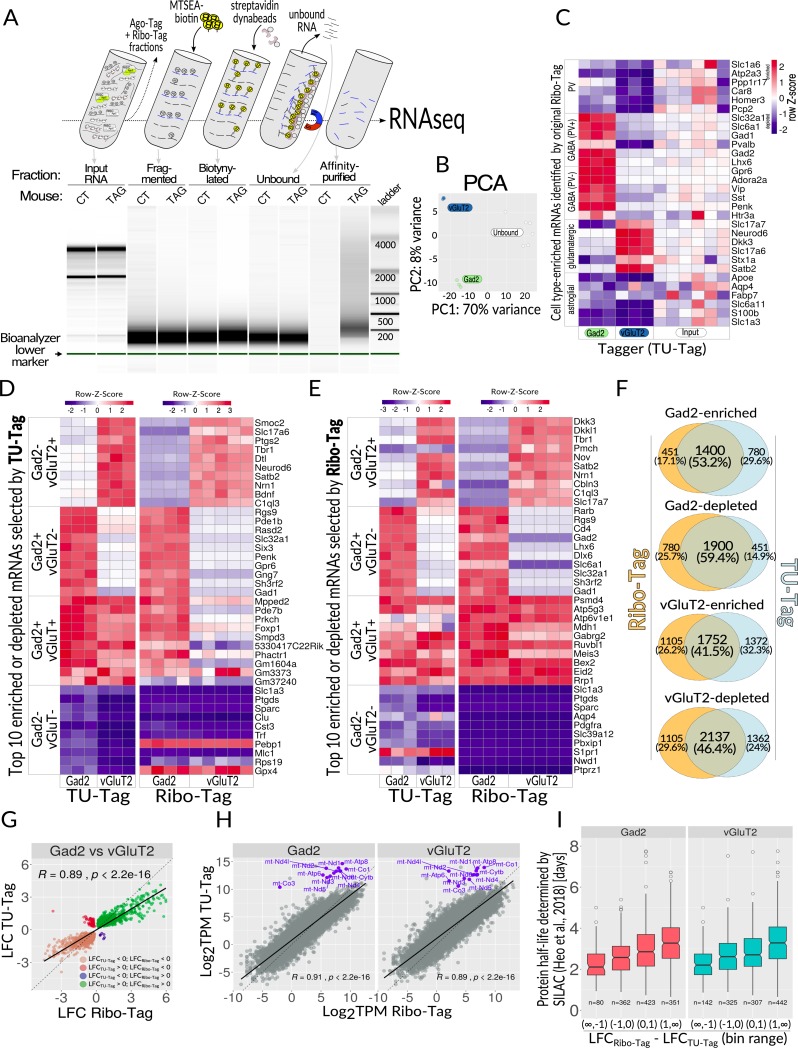
Fig 5. TU-Tag.
(A) Top, overview of key steps of the procedure. Tissue homogenate, following removal of nuclei and cell debris (S1 supernatant), is split into fractions for purifying specific classes of nucleic acids. Thiolated RNA from the TU-Tag is fragmented, biotinylated, and affinity purified using streptavidin-coated dynabeads, and eventually sequenced. Bottom, Bioanalyzer 2100 analysis of the consecutive fractions from the procedure on top. (B) PCA of the data from two analyzed cell populations (vGluT2 and Gad2 neurons, n = 3 each) and unbound fraction. (C) Heatmap showing relative distribution of TU-Tag TPM values for cell type–enriched mRNAs selected based on data obtained with the original Ribo Tag mouse. Each column represents one biological sample. Z-score for each row was calculated to set the input levels to 0: Z = (x–mean(input))/SD(row), where SD is standard deviation. (D) Ribo-Tag assessment of enrichment and/or depletion of 40 genes chosen based on TU-Tag; top 10 genes for each category were selected as follows: enriched in vGluT2 and depleted in Gad2 (LFCvGluT2 > 0, LFCGad2 < 0), enriched in Gad2 and depleted in vGluT2 (LFCvGluT2 > 0, LFCGad2 < 0), enriched in both Gad2 and vGluT2 (LFCvGluT2 > 0, LFCGad2 > 0), depleted in both Gad2 and vGluT2 (LFCvGluT2 > 0, LFCGad2 > 0). For each category, the top 10 genes were selected on the basis of the rank metric (|rnkGad2|+|rnkvGluT2|); mitochondrially encoded genes were excluded from the analysis. (E) Similar to panel D, except that the gene selection was done on the basis of Ribo-Tag and then juxtaposed with TU-Tag. (F) Comparison of the overlaps between Ribo-Tag and TU-Tag modalities with respect to the number and direction of significant enrichments (LFC > 0, FDR < 0.1) and depletions (LFC < 0, FDR < 0.1). LFC was calculated by comparing with S1 input supernatants for Ribo-Tag and unbound fractions for TU-Tag affinity purification. All overlaps were deemed highly significant by the hypergeometric test. (G) Direct comparison of TU-Tag and Ribo-Tag between two tested neuronal types: Gad2 and vGluT2 cells, showing a high correlation of data, albeit some genes display discrepant behavior between the modalities. (H) Scatterplots of log2-transformed TPM values from TU-Tag and Ribo-Tag modalities plotted against each other. mtDNA encoded genes were highlighted in blue and labeled with gene symbols. (I) Correlation of RNA turnover inferred from Tagger data with SILAC-determined protein turnover times [33] for both tested neuronal subtypes. For each cell subtype, the x-axis represents differences between LFCRibo-Tag and LFCTU-Tag (both calculated with respect to the corresponding S1 and unbound RNA, respectively), binned into four value ranges: (−∞, −1), (−1, 0), (0, 1), and (1, ∞). The y-axis represents the turnover time inferred from SILAC experiments on primary neuronal cultures [33]. RNAs with faster turnover (as determined by SILAC) tend to have LFCRibo-Tag−LFCTU-Tag lower than RNAs with slower turnover. All differences between groups were significant (Kruskal-Wallis test with post hoc Dunn test, see S2 Table for detailed test results). The raw data on which panels C, D, E, and I are based can be found in S1 Data. CT, control; FDR, false discovery rate; Gad2, glutamic acid decarboxylase 2; LFC, Log2 fold change; mtDNA, mitochondrial DNA; MTSEA,methyl thiosulfonate ethylammonium; PCA, principal component analysis; RNAseq, RNA sequencing; SILAC, stable isotope labeling with amino acids in cell culture; TAG, Tagger; TPM, transcripts per million; vGluT2, vesicular glutamate transporter 2.

