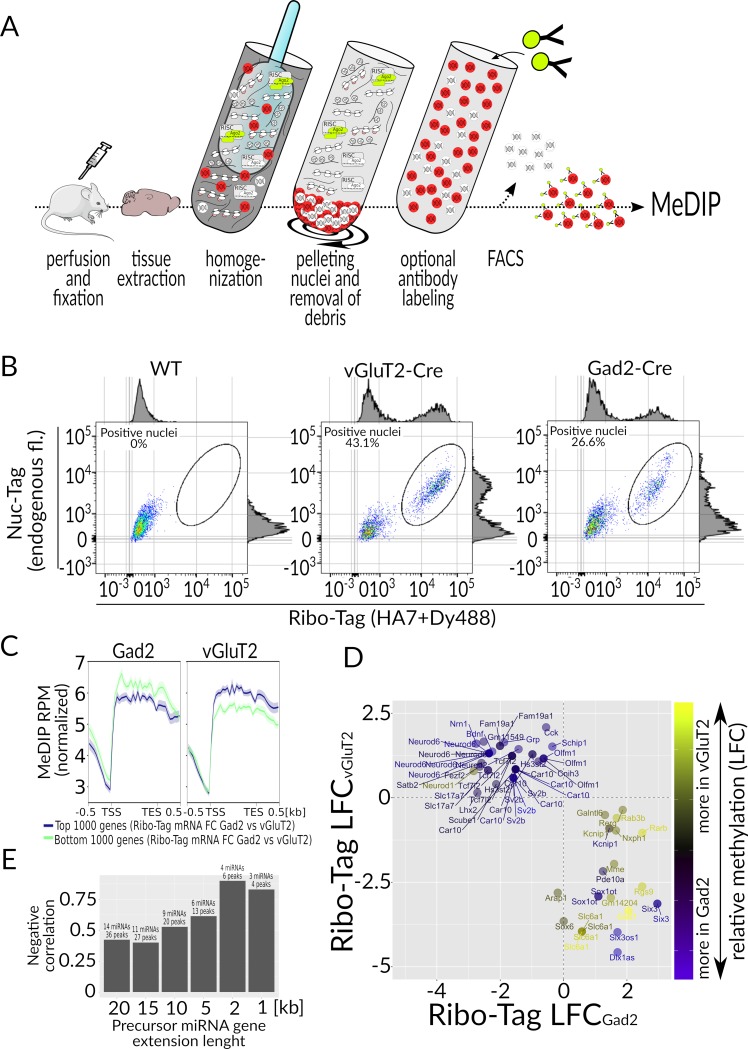
Fig 6. Nuc-Tag.
(A) Overview of the procedure. Mouse is perfused with 10% formalin and the brain is extracted and homogenized. Nuclei are pelleted to remove the cytoplasmic content. Then, the nuclei are resuspended, optionally labeled with antibodies, and subjected to FACS. From the enriched fraction of nuclei, DNA is isolated and subjected to MeDIP sequencing. (B) Representative FACS scatterplots of the fixed nuclei suspensions from WT, vGluT2-Tagger, and Gad2-Tagger brains, assayed for Rpl22-HA (x-axis) and Nuc-Tag endogenous fluorescence (y-axis). (C) Aggregate plots of methylation signal of the top 1,000 and bottom 1,000 differentially expressed genes, ordered by rnk = LFC*(−log(FDR)) (as determined by Ribo-Tag). (D) Comparison of Ribo-Tag data and Nuc-Tag (MeDIP) data; genes with |LFCGad2 versus vGluT2| > 2, corresponding FDR < 0.1) and differentially methylated (|LFCMeDIP| > 1, FDRMeDIP < 0.1) were plotted; relative methylation differences are reflected by the continuous color scale. (E) Correlation of differential methylation and miRNA gene expression, depending on the distance of the methylation peak from the gene TSS. The raw data related to panels D and E can be found in S1 Data. Ago2, Argonaute 2; Cre, causes recombination; FACS, fluorescence activated cell sorting; FDR, false discovery rate; fl, fluorescence; Gad2, glutamic acid decarboxylase 2; LFC, Log2 fold change; MeDIP, methylated DNA immunoprecipitation; miRNA, micro RNA; RISC, RNA-induced silencing complex; Rpl22-HA, large subunit ribosome protein 22-hemagglutinin (Ribo-Tag protein); RPM, reads per million; TES, transcription end site; TSS, transcription start site; vGluT2, vesicular glutamate transporter 2; WT, wild-type.

