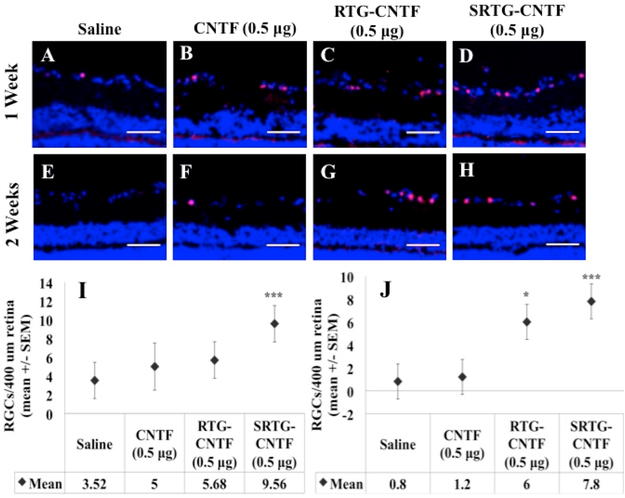
Figure 2.
Expression of Brn3a in the retina following ONC and the appropriate intravitreal injection. One week (A–D) and 2 week (E–H) retina sections from the four treatment groups (SRTG-CNTF (0.5 μg), RTG-CNTF (0.5 μg), CNTF (0.5 μg), and saline) are shown in the top two rows. Blue staining indicates DAPI. Red staining indicates Brn3a expression. Scale bar = 50 μm. *p < 0.05 and ***p < 0.001.

