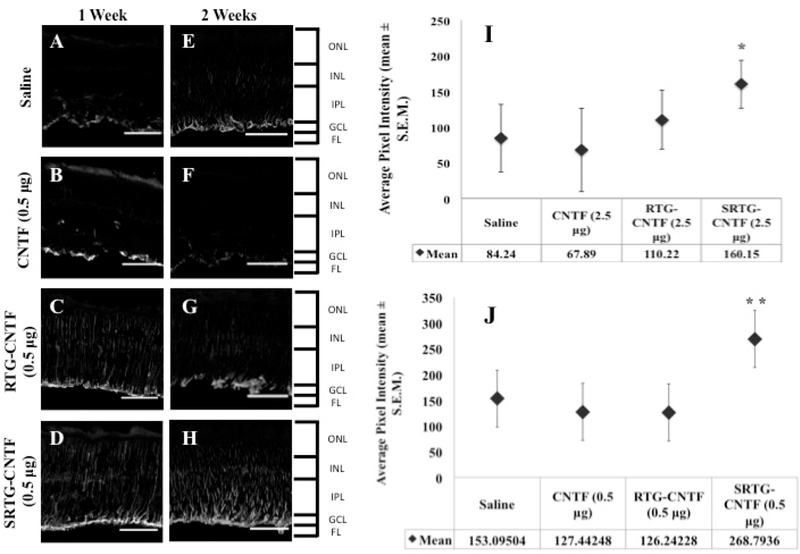
Figure 6.
Response of Müller glial cells to ONC and each subsequent intravitreal injection examined using a GFAP antibody. After 1 week post-ONC and appropriate intravitreal injection, GFAP staining in Müller cells is shown in saline, CNTF, RTG-CNTF, and SRTG-CNTF groups (A–D). Quantification shows an increase in Müller cell expression seen in the SRTG-CNTF group compared to the saline control at the 1 week time point (I). At 2 weeks post-ONC and appropriate intravitreal injection, there was an increased amount of Müller cell expression in all groups (E–H). There was a significant increase in the SRTG-CNTF group compared to all other groups (J). ONL: outer nuclear layer; INL: inner nuclear layer; IPL: inner plexiform layer; GCL: ganglion cell layer; FL: fiber layer. Staining indicates GFAP expression. Photomicrographs were captured at 20× magnification. Scale bar = 100 μm. *p < 0.05 and **p < 0.01.

