Figure 7.
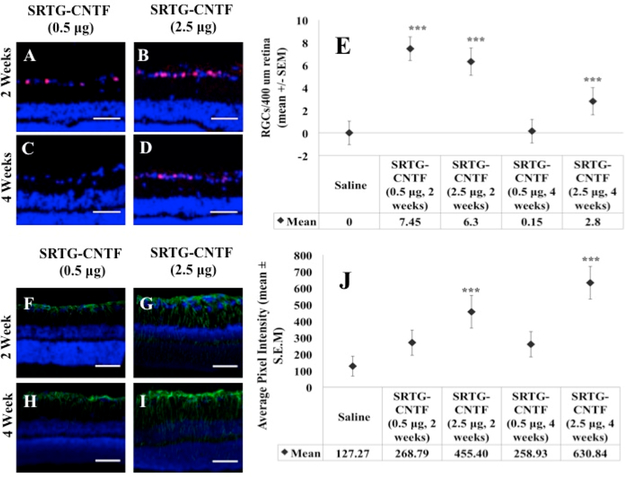
Larger amounts of CNTF loaded into the SRTG system increased the length of survival of RGCs and expression of GFAP to the 4 week time point. After 2 weeks post-ONC, both low and high CNTF groups showed a significant difference in the number of remaining Brn3a positive cells to the saline control (A, B, E). After 4 weeks post-ONC, only the high CTNF groups showed a significant difference in the number of Brn3a expressing cells compared to the control (C, D, E). For GFAP expression analysis, after 2 weeks post-ONC, both low and high CNTF groups showed a significant difference between the saline control (F, G, J). After 4 weeks post-ONC, there was no significant difference between the low CNTF group and saline (H, J). After 4 weeks, there was a significant difference between the high CNTF group and saline group (I, J). Red staining in A–D indicates Brn3a expression. Green staining in F–I indicates GFAP expression. Photomicrographs were captured at 20× magnification. Scale bar = 50 μm. ***p < 0.001.

