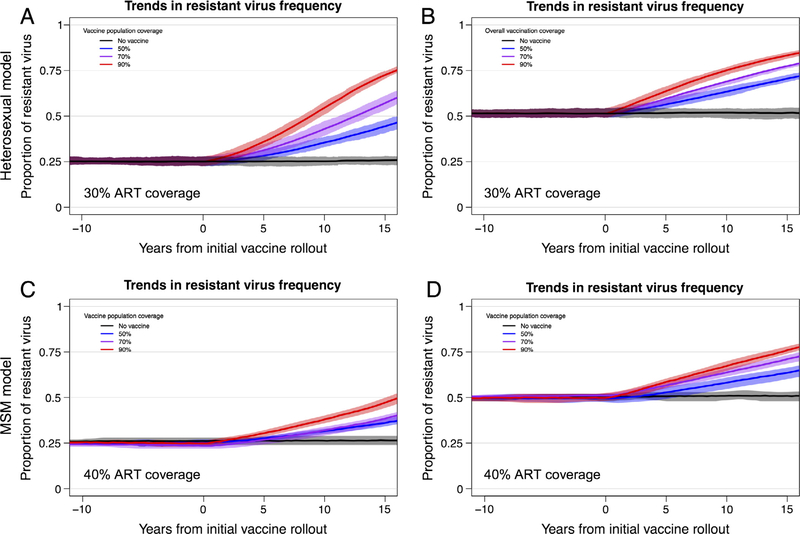
Fig. 1.
Trends in the proportion of HIV strains that are resistant to a vaccine-driven immune response. Trends in the proportion of resistant strains among all HIV strains (with interquartile ranges) for 20 replicate HIV epidemic simulations from heterosexual (panels A and B) and MSM (panels C and D) models. Panels A and C depict results from epidemic scenarios that included an initial resistant strain (VE = 0.0) at a proportion = 0.25 and a sensitive virus (VE = 0.75). Panels B and D depict results from scenarios with initial resistant strain proportion = 0.50 and a sensitive virus VE = 0.90. Background population ART coverage was at 30% for the heterosexual model and 40% for the MSM model. (See Fig. S1 for equivalent results from heterosexual model scenarios in which a high-risk subgroup is preferentially targeted for vaccination, which leads to substantially decreased overall vaccination coverage but results in similar effects of HIV adaptation on resistant virus frequency.)

