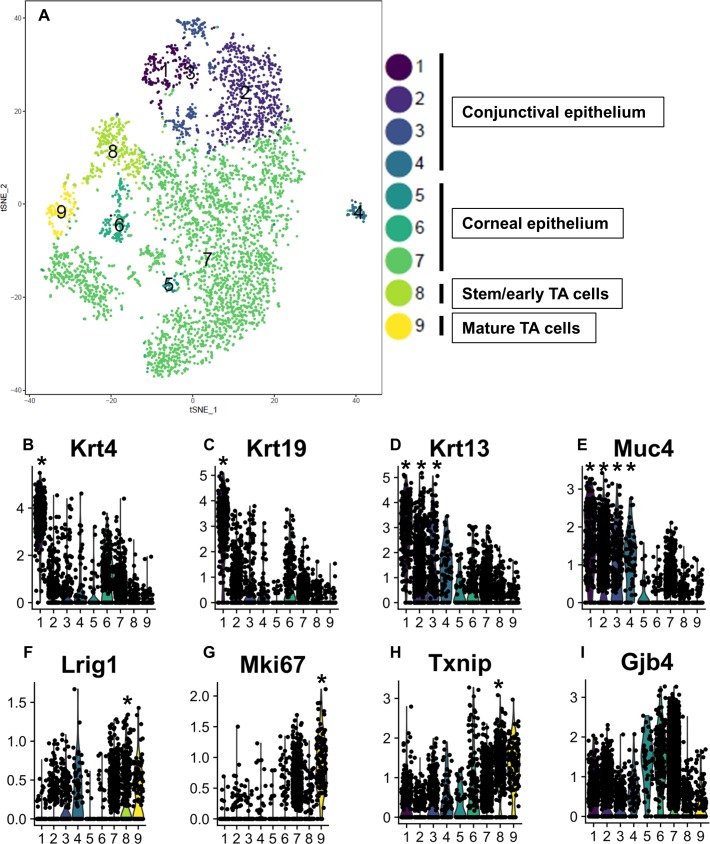
Figure 5.
scRNA-seq identified nine subclusters of cells from integrated samples of wild-type and Beclin 1+/− mouse limbal/corneal epithelial cells. (A) Cell-type clusters. We used t-SNE to visualize the re-clustering (color coding) of the original epithelial cell clusters from the integrated samples of wild-type and beclin 1+/− epithelial cells, based on the expression of known marker genes. The percentage of stem/early TA cells (cluster 8) in total corneal/limbal epithelial cells from beclin+/− mice is 50% less than wild-type mice. For the table, we used the “prop.table” command from the R base library. (B–I) Violin plots show the expression of gene markers from the nine clusters. Clusters are color coded. P values are tested by the Wilcoxon rank sum test. *P < 0.05.

