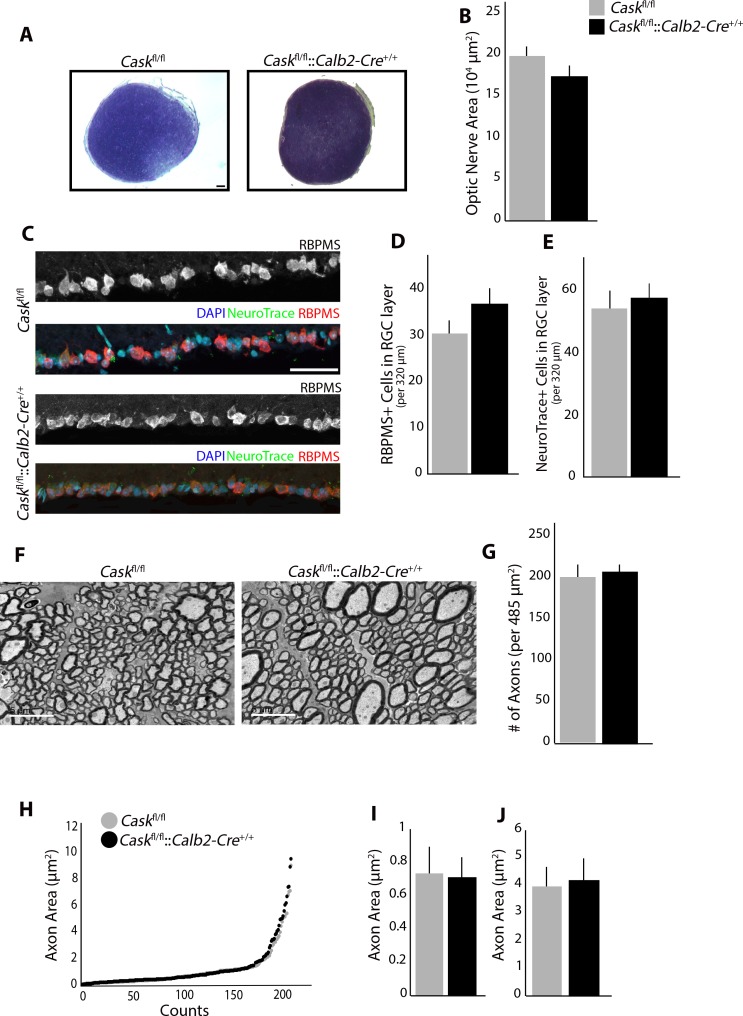
Figure 5.
RGC-derived CASK is not required for RGC survival. (A) Toluidine blue staining shows no reduction in ON size in Caskfl/fl::Calb2-Cre+/+ compared to Caskfl/fl. Scale bar: 50 μm. (B) Quantification of cross-sectional area in Caskfl/fl::Calb2-Cre+/+ compared to Caskfl/fl. (n = 4 mice per genotype). (C) No reduction in number of cells in GCL layer using RBPMS (RNA-binding protein with multiple splicing) or NeuroTrace. Scale bar: 50 μm. (D) Quantification of number of cells in GCL using RBPMS in Caskfl/fl::Calb2-Cre+/+ compared to Caskfl/fl. (n = 10 mice per genotype). (E) Quantification of number of cells in GCL using NeuroTrace in Caskfl/fl::Calb2-Cre+/+ compared to Caskfl/fl. (n = 6 mice per genotype). (F) TEM of RGC axons in the ON in Caskfl/fl::Calb2-Cre+/+ compared to Caskfl/fl. Scale bar: 5 μm. (G) Quantification of density of axons per image in Caskfl/fl::Calb2-Cre+/+ compared to Caskfl/fl. (n = 4 mice per genotype). (H–J). Analysis of axon area in Caskfl/fl::Calb2-Cre+/+ ON compared to Caskfl/fl. Quantification of the average size of fine axons (I) and course axons (J). For all panels data are plotted as mean ± SEM.

