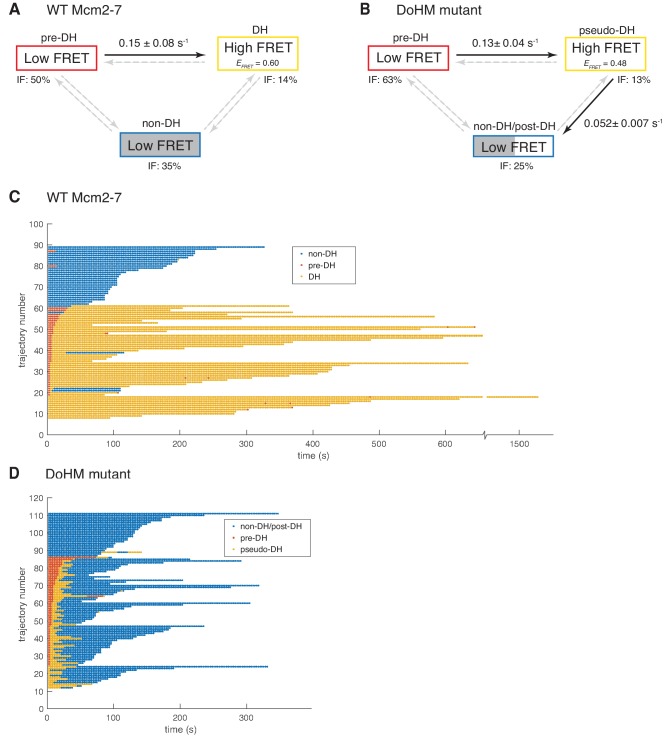
Figure 6. Wild-type Mcm2-7 and the DoHM mutant attempt double-hexamer formation only once.
To focus on double-hexamer formation, analysis was restricted to the time interval from second Mcm2-7 binding to the time of one or both Mcm2-7 departure. (A–B) Kinetic models of transition among the three indicated EFRET states. Pooled single-molecule fluorescence records from helicase loading experiments using (A) Mcm2-7 or (B) Mcm2-74-178A were globally fit (see Materials and methods) to generalized three-state kinetic models (i.e. all possible inter-state transitions were allowed). Black arrows indicate kinetically significant reaction steps; gray arrows indicate steps with rate constants that are not significantly greater than zero (see Figure 6—figure supplement 1). Fits also yielded the fraction (IF) of molecules in each state at the time of second hexamer binding. In the wild-type Mcm2-7 model (A), the transition from pre-DH to DH is the only process that occurs at an appreciable rate, while in the DoHM-mutant model (B) both pre-DH to pseudo-DH and pseudo-DH to post-DH steps are significant. (C–D) State rastergrams from the kinetic models. Each trajectory (horizontal line) indicates the state assigned by the model to a single-molecule record with wild-type Mcm2-7 (C) or the DOHM mutant (D), starting from the time of second hexamer binding. Pre-DH (red lines), DH or pseudo-DH (yellow lines) and post-DH or non-DH (blue lines) states are indicated. Trajectories are sorted by the onset time of the DH or pseudo-DH state, then by record length. Each record ends either due to the end of the experiment or loss of signal of one or both Mcm2-7 molecules. The blank region at the bottom of each rastergram represents low signal-to-noise records excluded from analysis (see Materials and Methods). Rare transitions (e.g. occasional transitions into or out of non-DH in wild-type Mcm2-7) which do not occur at statistically significant rates may reflect ambiguities in assigning time segments, particularly when the transitions are between two states with the same (zero) EFRET.
Figure 6—figure supplement 1. Complete set rate constants (s−1) and EFRET values derived from the kinetic model fits (Figure 6).


